QPR Software Plc was founded in 1991 and is a mature player in the fields of Process Mining, BPA, Enterprise Architecture and Performance Management. Their QPR ProcessAnalyzer solution offers advanced analytical features for the identification of case clusters and root causes. Other highlights include process predictions, customizable dashboards and enhanced BPMN modeling. Customers can resort to various deployment options and extensive ETL capabilities. A highly detailed knowledge base is a win for developers, giving valuable instruction on how to customize the configuration by using scripting commands. QPR’s pool of customers is highly diverse and includes industries and fields like banking, telecommunications, energy, civil engineering and governmental institutions.
Tool Name
QPR ProcessAnalyzer
Vendor
QPR Software Plc (Helsinki, Finland)
Company Size
51-100 employees
Free Trial
Upon request
Licenses
Commercial
Deployment
SaaS, Cloud , On-Premises , Standalone
SaaS: Dedicated QPR-hosted environment (exclusive access for customer)
Multi-tenant setup sharing same AWS resources for users
Standalone: A native QPR ProcessAnalyzer Excel Add-In is available
Embedded In
–
Tested Version
2020.4.0.41643 (SaaS) - Tested in 06/2020
Data Management
Import File Types
CSV, XES
Database Connections
ODBC drivers, OLE DB, ADO.NET (SQL), SAP (R/3 SAP .NET Connector), Microsoft SQL Server
Adapters/Connectors
Microsoft Dynamics AX & NAV, SAP, Oracle, Salesforce, Epicor, ServiceNow, Infor M3, IFS, CDK AutoMaster, M-Files, generic Web Services
Integrated ETL Functionality
QPR ProcessAnalyzer ETL scripts
Data Anonymization & Pseudonymization
Data Loading
Data Refresh: Incremental data loading, appending new data to an existing set of data
Scheduled Jobs = Automatic data loading in defined time intervals
Data Refresh , Scheduled Jobs
Character Encodings
UTF-8 compatibility tested with special characters and various languages: Korean, Japanese, Trad. & Simplif. Chinese, Hebrew, Arabic, Russian
UTF-8 (verified ) + various more encodings
Any character encoding (database collation) available in MS SQL Server can be used
Attribute Types
Case-level , Event-level
Specify Business Hours
Working week , Multiple shifts/day , Exclude days , Holiday calendar
Define Event Order
Manual definition of event ordering in case of identical timestamps. This criterion does not consider automatic ordering by the tool.
By selected column, by custom sequence of activities
Deviation from defined thresholds can be detected through color differentiation
Advanced Charts
Dashboard offers >5 different chart types
World Map
Latitude & longitude coordinates , Location by attribute (e.g. country codes, city names)
Save Filter Settings
UI Languages
English
Share & Collaborate
Share selection ; Dashboard sharing
Security & Compliance
Role-Based Access
User Authentication
Basic; LDAP; SAML 2.0; IP-based access restrictions available from QPR Cloud
Audit Logs
Distinctive Focus and Features
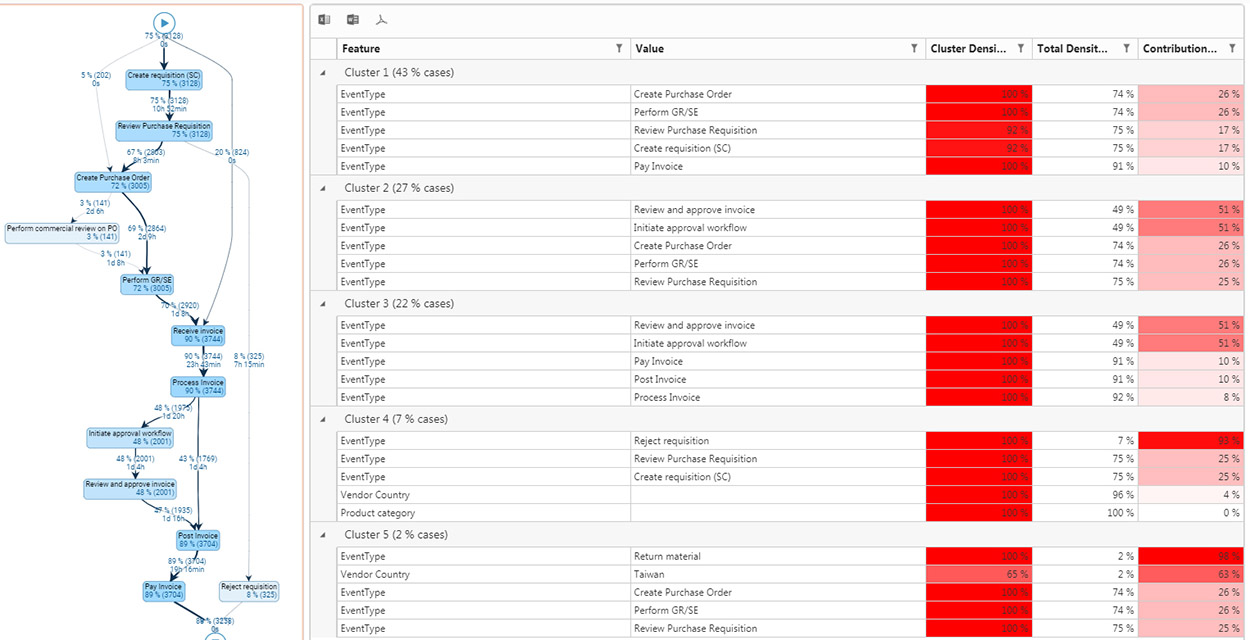
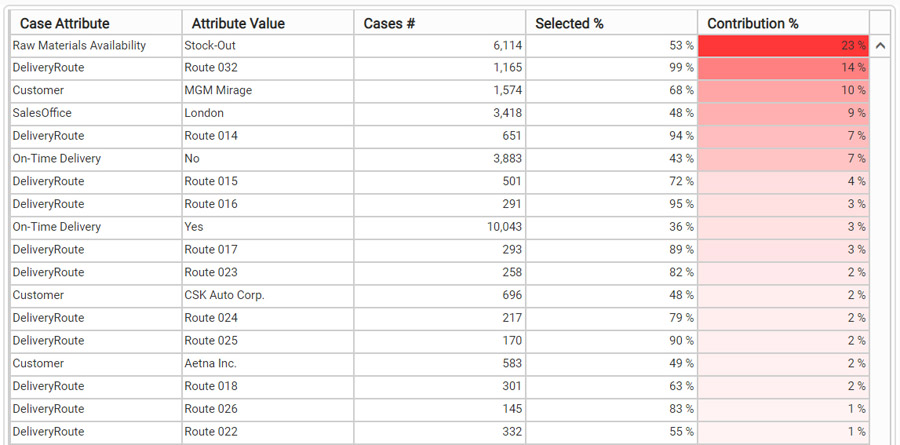
Advanced analytical capabilities: The Root Cause Analysis shows correlations between filtered cases and their respective case attributes, helping to identify potential root causes. The Clustering Analysis is another powerful feature. Based on MI/AL algorithms, cases can be grouped in a way that cases inside a cluster are similar to each other which, for instance, can be used to check data integrity.
Powerful ETL capabilities: QPR ProcessAnalyzer can extract source data from different database types and offers connectors for various ERP systems such as Microsoft Dynamics AX & NAV, Infor M3 and SAP. Data extraction, transformation and loading can be performed with SQL queries implemented by scripts.
Secure environment: Commercial customers have several deployment options to choose from: SaaS for a dedicated QPR-hosted environment, AWS-based cloud hosting, On-Premises or a proprietary Excel Add-in as a Standalone option. With a robust and secure user administration, role-based access can be defined even on case level, meaning that permissions can be set for specific case attributes such as the region or case owner. Users can be authenticated through a federated SAML 2.0 authentication or LDAP/AD. IP-based access restrictions are available in the QPR Cloud as well.
Disclaimer: The timeliness of provided information is based on the tested version and date as stated under “Tested Version”. No guarantee can be given about the correctness and accuracy of the information contained.
Click to enlarge
Tap to enlarge
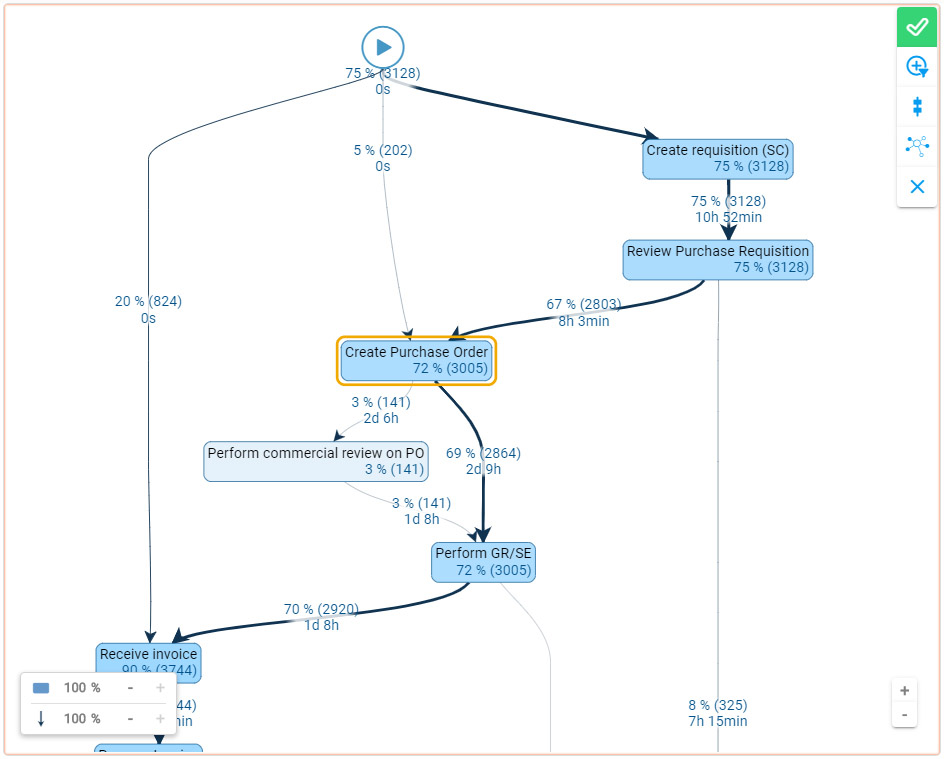
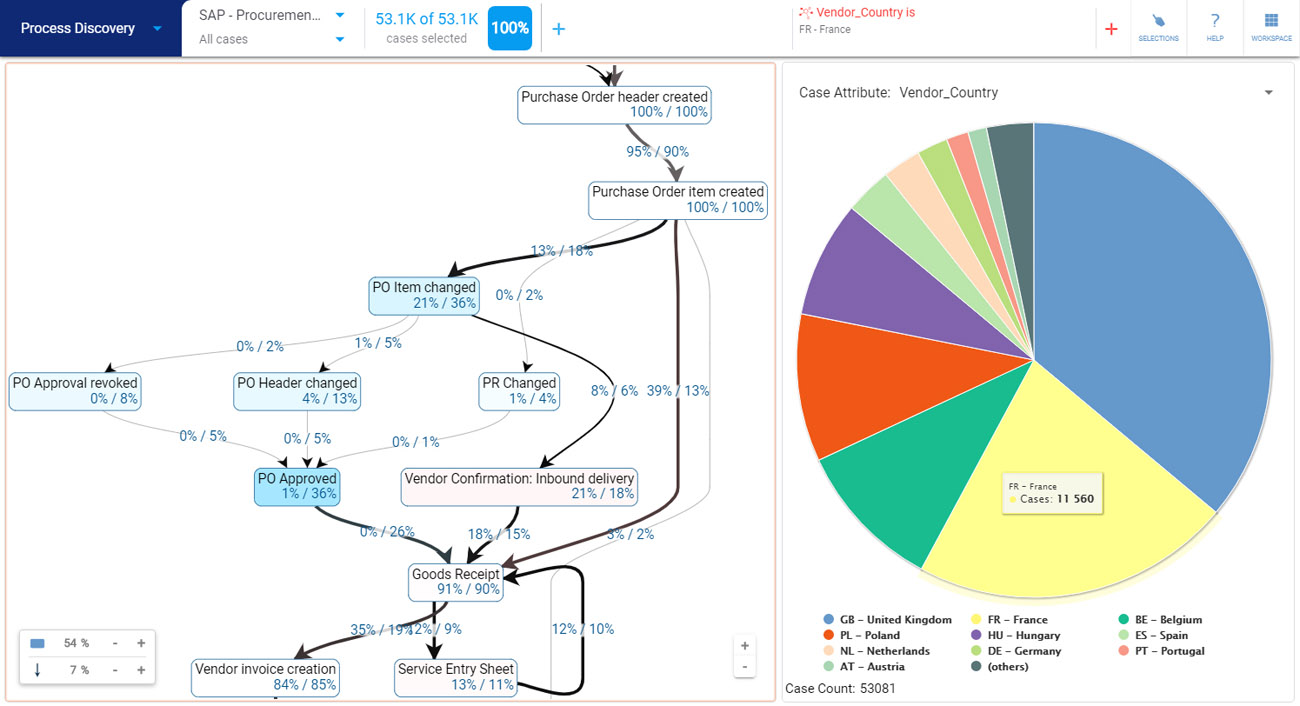
Process Graph
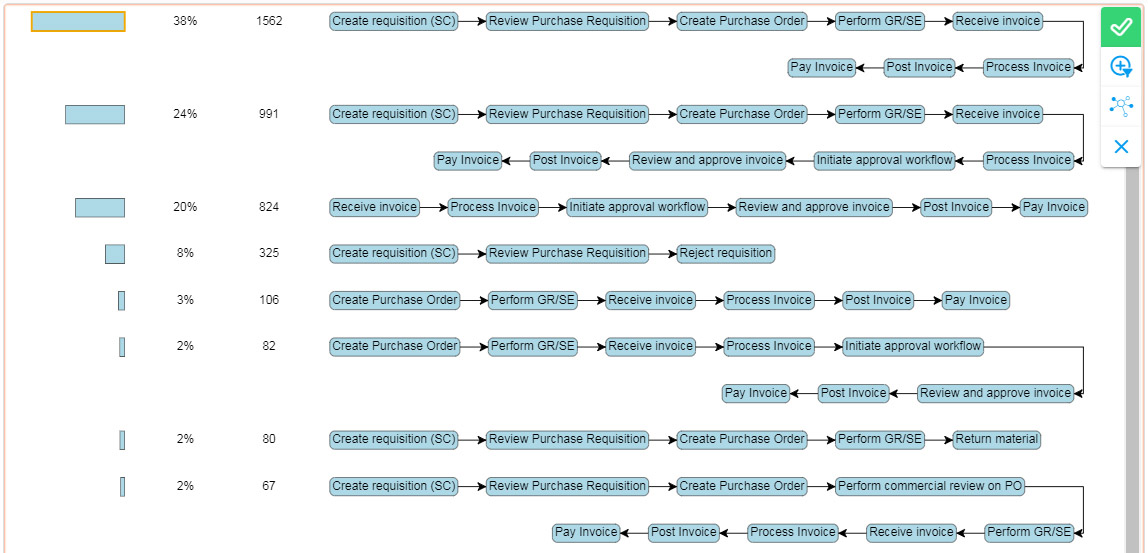
Process Variants
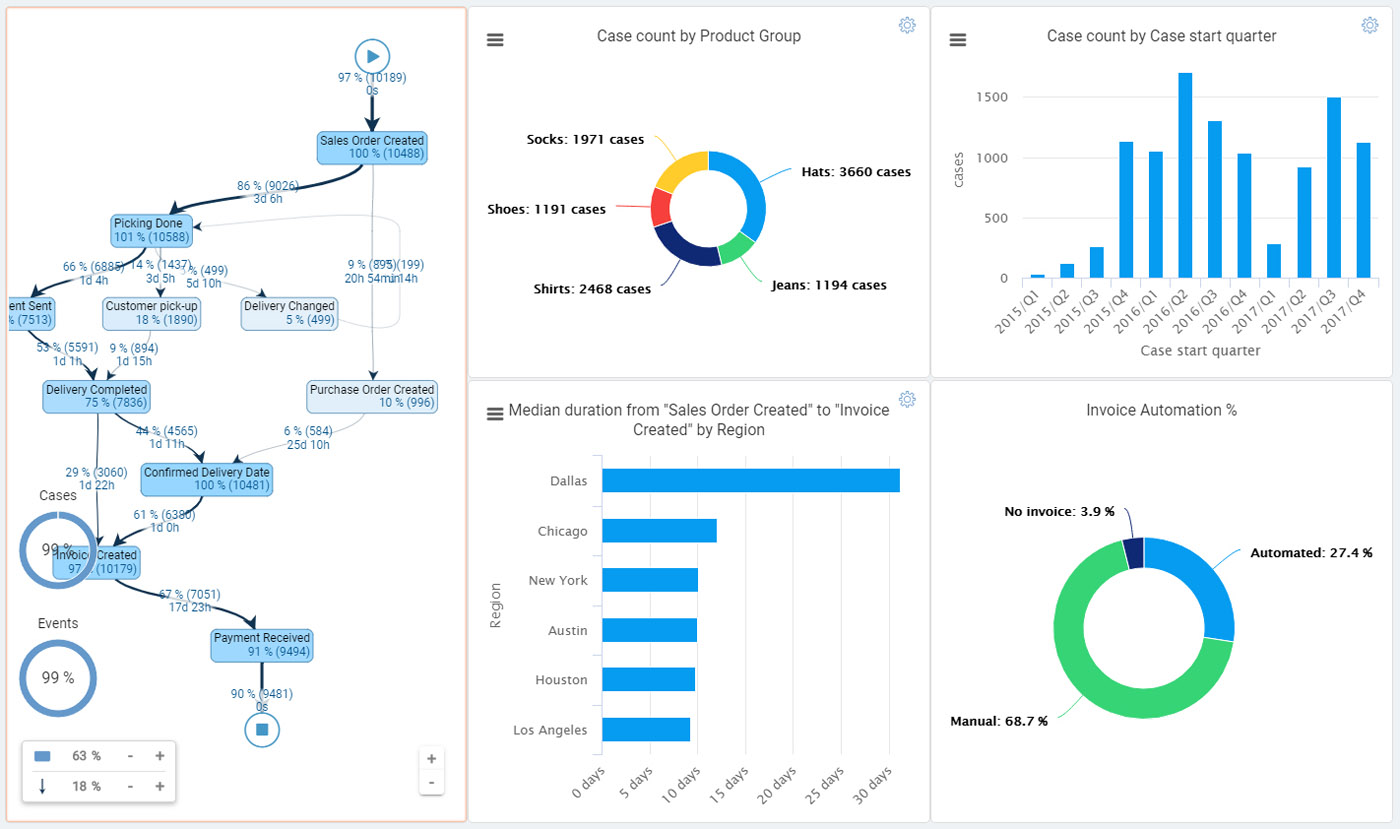
Dashboards
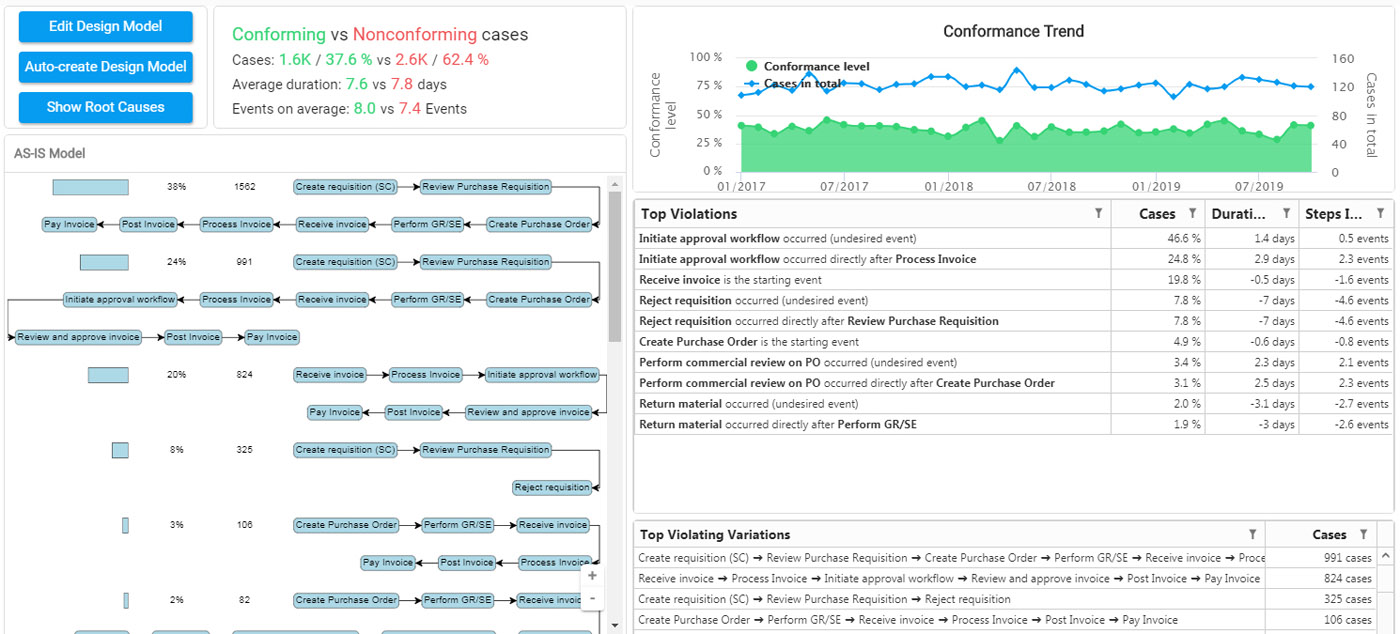
Conformance Checking
Benchmarking
Clustering Analysis
Root Cause Analysis
Appetite for an additional visual impression of QPR ProcessAnalyzer?
This website uses cookies so that we can provide you with the best user experience possible. Cookie information is stored in your browser and performs functions such as recognizing you when you return to our website and helping our team to understand which sections of the website you find most interesting and useful.
Essential Cookies
Essential cookies enable basic functions and are necessary for the proper function of the website.
3rd Party Cookies
This website uses third party cookies. Google Analytics is used to help us improve our website by collecting anonymous information on how you use it. Content from third parties may also contain elements like YouTube videos which require cookies for proper functioning.
Please note that disabling third party cookies may prevent you from fully exploiting the features and services available.
Please enable Strictly Necessary Cookies first so that we can save your preferences!
Cookie Policy
For more information, please refer to our Cookie Policy.