South Korea-based Puzzle Data is a relatively new entrant in the Process Mining software market. The customer base includes companies in manufacturing, transportation, retail, mobile gaming and public institutions like hospitals and Korea’s Supreme Prosecutors’ Office. Puzzle Data’s ProDiscovery solution is made up of around 30 widgets (“puzzles”) that can be individually configured and added to any dashboard. While a Conformance Checking functionality is still in development, ProDiscovery offers sophisticated widgets for process discovery, statistical analyses, social networks and organizational graphs. Dashboards can be shared with users in the same organization. The architecture is designed for Big Data processing and is built on the open-source environments Apache Hadoop, Spark and the Elasticsearch engine.
Tool Name
ProDiscovery
Vendor
Puzzle Data Co., Ltd. (Seoul and Pohang, South Korea)
Company Size
11-50 employees
Free Trial
Upon request
Licenses
Commercial
Deployment
SaaS , On-Premises
Embedded In
–
Tested Version
2.0.42 (SaaS) - Tested in 04/2020
Data Management
Import File Types
CSV, TXT
Database Connections
JDBC drivers, e.g. Oracle
Adapters/Connectors
Adobe Analytics
Integrated ETL Functionality
Data Anonymization & Pseudonymization
Data Loading
Data Refresh: Incremental data loading, appending new data to an existing set of data
Scheduled Jobs = Automatic data loading in defined time intervals
Data Refresh , Scheduled Jobs
Scheduled Jobs upon request
Character Encodings
UTF-8 compatibility tested with special characters and various languages: Korean, Japanese, Trad. & Simplif. Chinese, Hebrew, Arabic, Russian
UTF-8 (verified ), EUC-KR
Attribute Types
Case-level , Event-level
Specify Business Hours
Working week , Multiple shifts/day , Exclude days , Holiday calendar
Holidays can be defined by the administrator
Define Event Order
Manual definition of event ordering in case of identical timestamps. This criterion does not consider automatic ordering by the tool.
By selected column, by custom sequence of activities
Start/End Timestamp
2 timestamps
Process Discovery
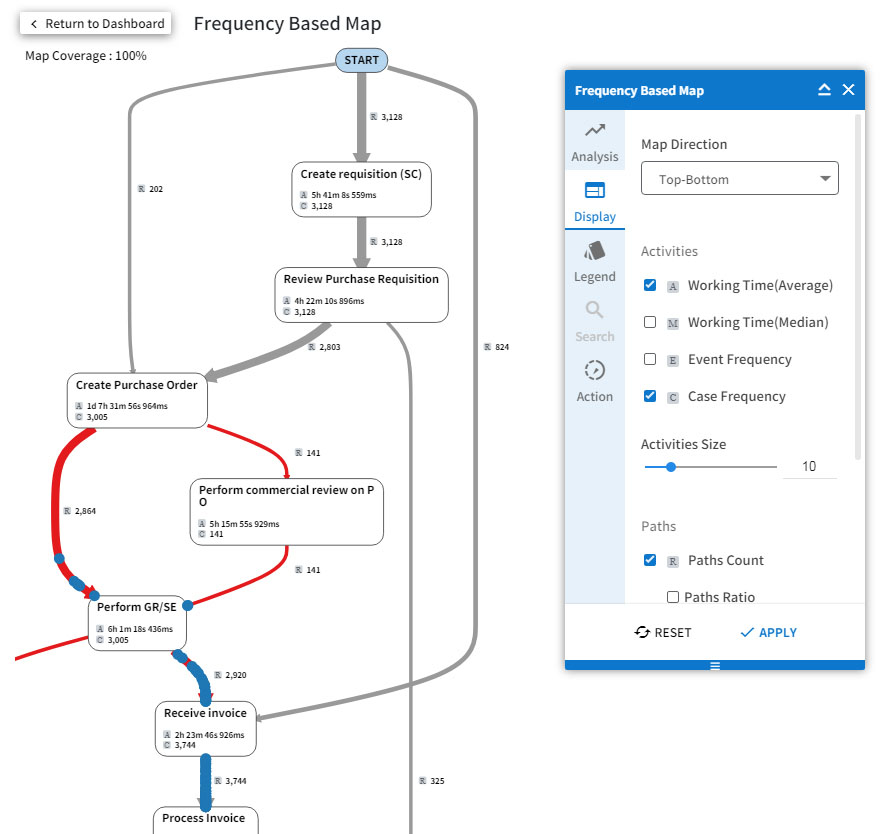
» Process Graph
As-Is Process Visualization
Directly-Follows Graph (horizontal, vertical)
Additional Heuristics Miner available with adjustable thresholds
Export As-Is Process Graph
For data exports (e.g. CSV) see “Export Reports” criterion
PNG, SVG
Performance Highlighting
Visual highlighting of process bottlenecks
Active time , Idle time
Process Animation (Replay)
Adjust speed , Adjust timeframe , Switch time mode , Zoom in case
Search and Filter in Graph
Search and find activity names (relevant for spaghetti-like graphs)
Filter activities/transitions directly from graph
Search , Filter
Graph Abstraction
Frequency Metrics
Activity frequency, Case frequency, Paths ratio
Paths ratio = # of arc / total # of arc
Time Metrics
The term “duration” is used when both active and waiting/idle times can be displayed
Avg/med duration
Additional Graph Metrics
Cost metrics , Custom metrics
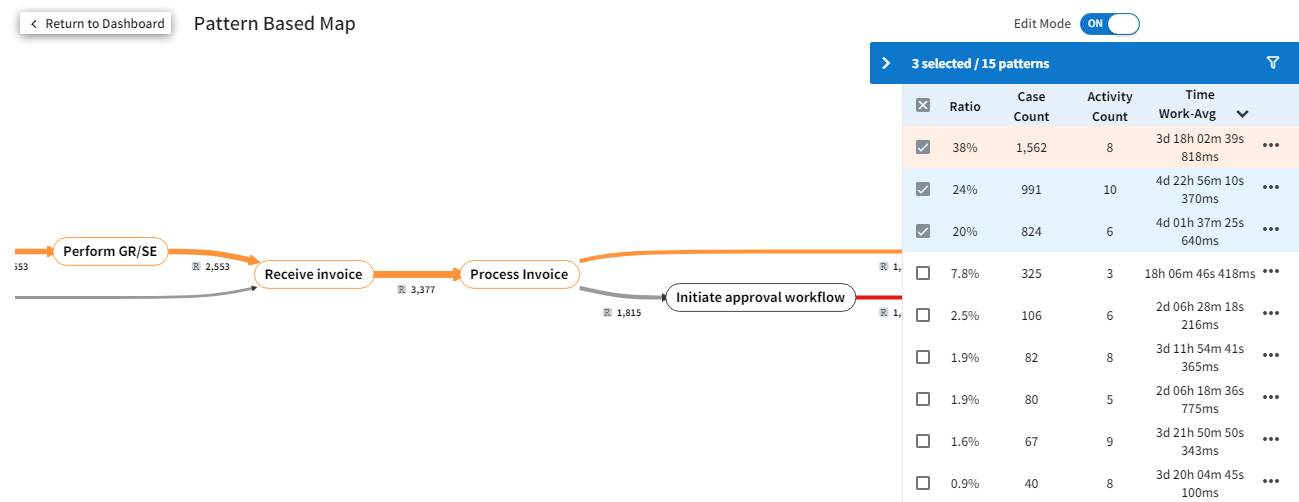
» Process Analysis & Analytics
Process Benchmarking
Visual comparison , Metric comparison
Process Benchmarking (Different Logs)
Visual comparison , Metric comparison
Root Cause Analysis
Variant Breakdown by
“Duration” refers to the case throughput time
Case count, event count, unique activity count, case-level performance (duration, active time, waiting time)
Aggregation for sorting by time: min/max/avg/med/std.dev
Case and Activity List
Activity List , Case List , Case List for Variants
View Case Details
Rework Analysis
Edge/Transition Details
From-to activities: List of ingoing and outgoing activities for any selected activity
List of all transitions , From-to activities
Conformance Checking
Compare As-Is and Target Process
Target Model Creation
Import model , Auto-create from as-is , Create new
Deviation from defined thresholds can be detected through color differentiation
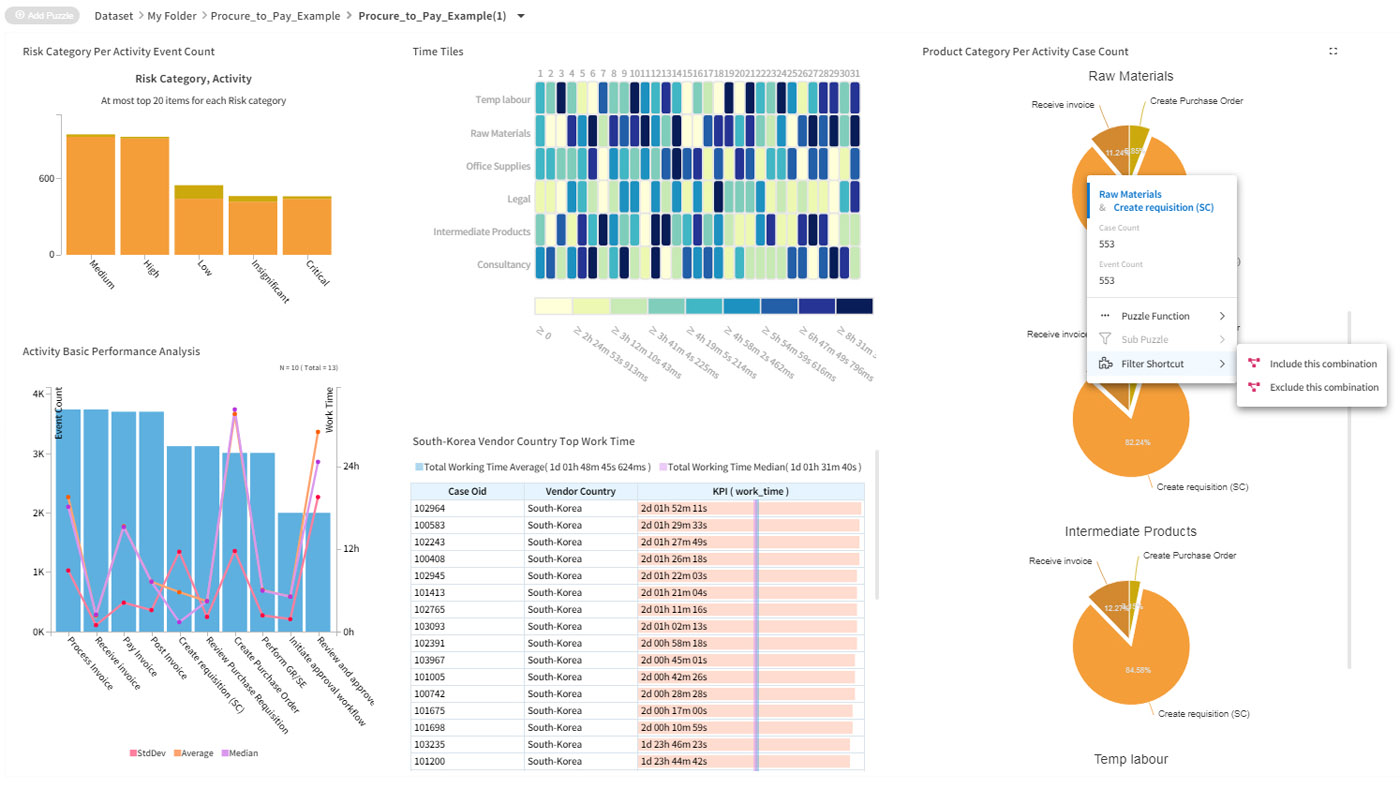
Advanced Charts
Dashboard offers >5 different chart types
World Map
Latitude & longitude coordinates , Location by attribute (e.g. country codes, city names)
Save Filter Settings
UI Languages
English, Korean
Share & Collaborate
Share selection ; Dashboard sharing; Memo widget for comments
Security & Compliance
Role-Based Access
User Authentication
Basic
Audit Logs
Distinctive Focus and Features
Process analytics: ProDiscovery’s “puzzle” library includes sophisticated widgets with various chart types that allow the user analyze the process from many dimensions.
Big Data processing: Puzzle Data’s solution is designed to process large datasets, being built on the open-source environments Apache Hadoop, Spark and Elasticsearch.
Disclaimer: The timeliness of provided information is based on the tested version and date as stated under “Tested Version”. No guarantee can be given about the correctness and accuracy of the information contained.
Click to enlarge
Tap to enlarge
Process Graph
Process Variants
Dashboards
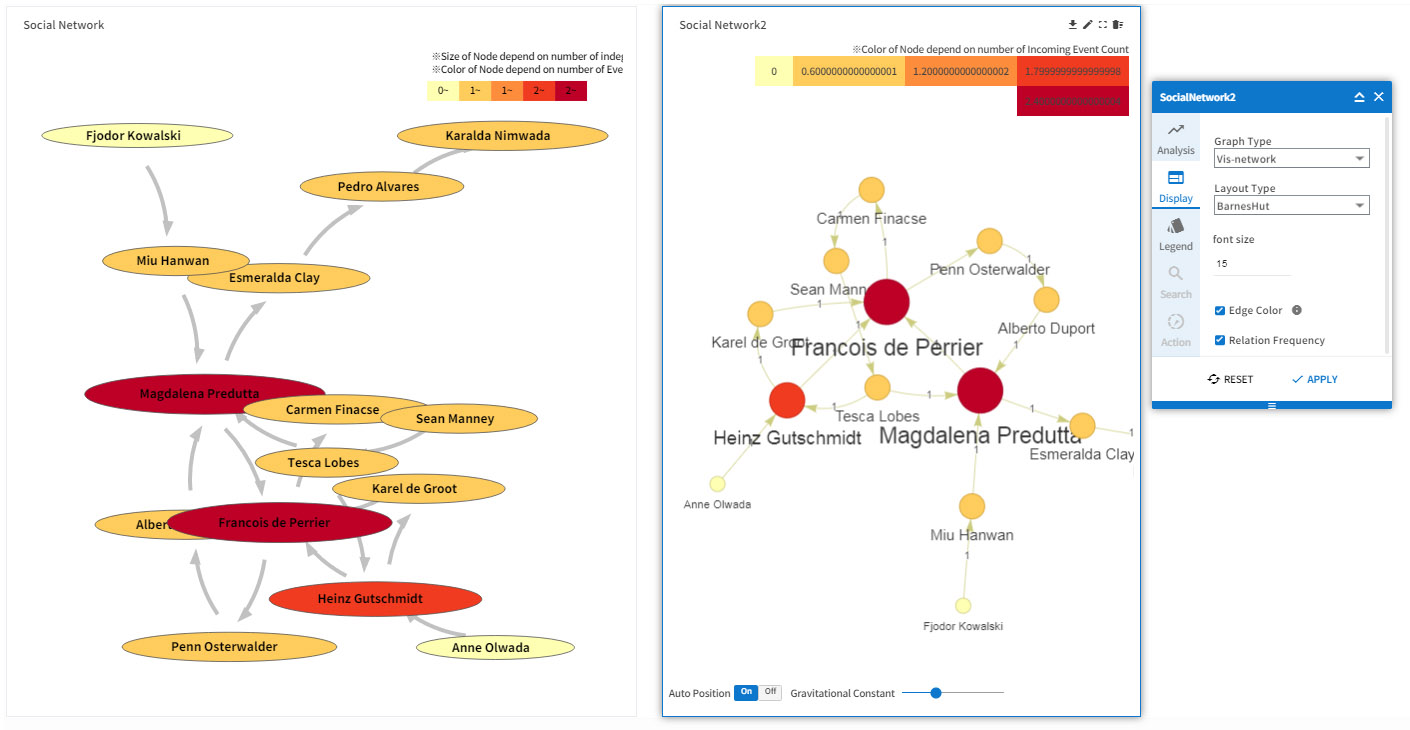
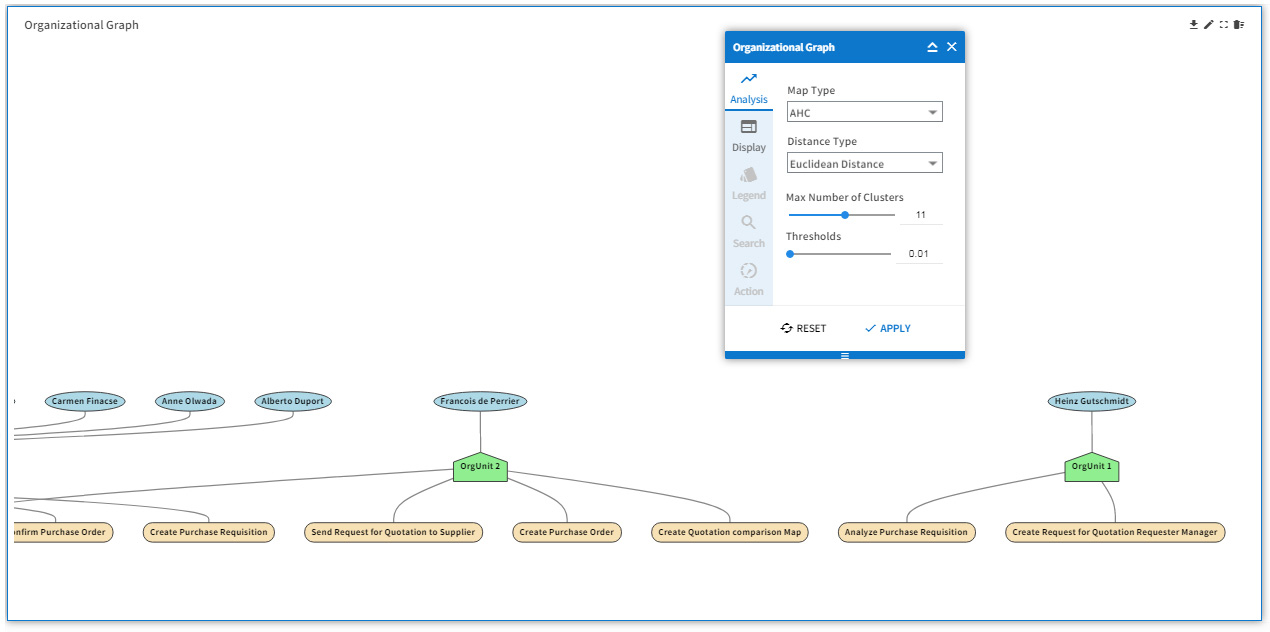
Social Network
Organizational Mining
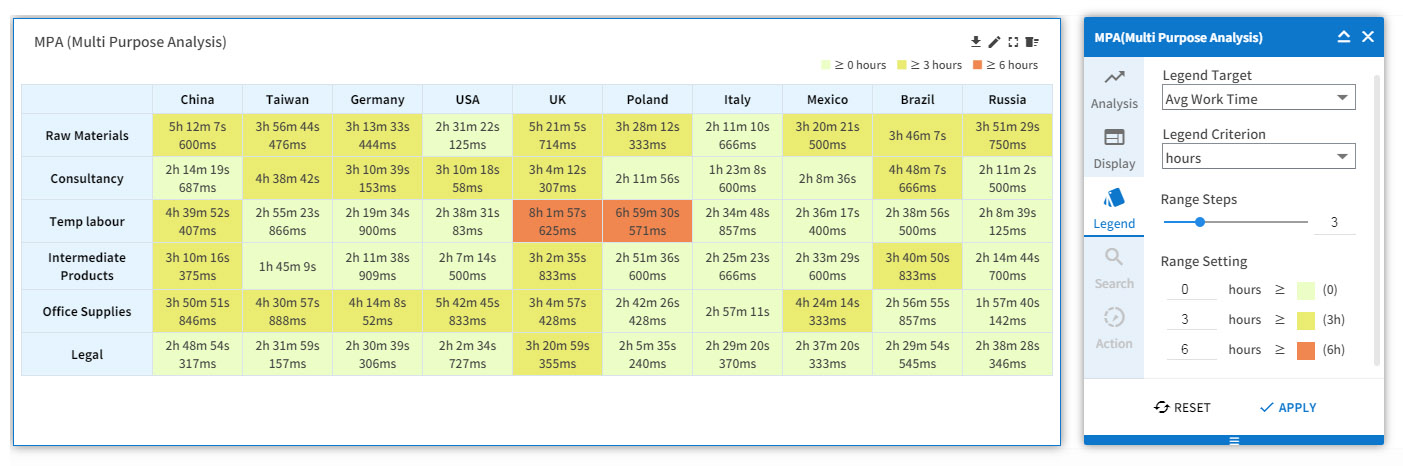
Multi-Purpose Analysis
Appetite for an additional visual impression of ProDiscovery?
This website uses cookies so that we can provide you with the best user experience possible. Cookie information is stored in your browser and performs functions such as recognizing you when you return to our website and helping our team to understand which sections of the website you find most interesting and useful.
Essential Cookies
Essential cookies enable basic functions and are necessary for the proper function of the website.
3rd Party Cookies
This website uses third party cookies. Google Analytics is used to help us improve our website by collecting anonymous information on how you use it. Content from third parties may also contain elements like YouTube videos which require cookies for proper functioning.
Please note that disabling third party cookies may prevent you from fully exploiting the features and services available.
Please enable Strictly Necessary Cookies first so that we can save your preferences!
Cookie Policy
For more information, please refer to our Cookie Policy.