With its first version released in 2015, Minit has developed a powerful Process Mining tool with advanced process enhancement capabilities. Features like hierarchical visualization, the simulation of “what if” scenarios and interactive, Qlik-based dashboards deserve special attention. The software offers a clean and user-friendly UI. Minit’s use cases include projects in banking, logistics, e-commerce and telecommunications with common processes like Purchase to Pay (P2P), Order to Cash (O2C) and IT Service management (ITSM). Webinars and the newly-launched Minit Academy help users leverage the full potential of the tool.
Tool Name
Minit
Vendor
Minit j.s.a. (Bratislava, Slovak Republic)
Company Size
11-50 employees
Free Trial
Upon request
Licenses
Academic, Commercial
Deployment
Cloud , On-Premises , Standalone
Embedded In
Qlik Sense (dashboards only)
Tested Version
5.4 (full enterprise license for Standalone and Cloud for dashboards) - Tested in 04/2020, updated in 06/2021
Data Management
Import File Types
CSV, XES, MXML, XLS(X)(M)(B), MDB, ACCDB
Supported file types can be uploaded in compressed format
Database Connections
Microsoft SQL server, ODBC drivers such as Oracle, MySQL, PostgreSQL, Sybase
Adapters/Connectors
SAP, SalesForce, ServiceNow, Oracle EBS
Integrated ETL Functionality
Data Anonymization & Pseudonymization
Data Loading
Data Refresh: Incremental data loading, appending new data to an existing set of data
Scheduled Jobs = Automatic data loading in defined time intervals
Data Refresh , Scheduled Jobs
Scheduled Jobs on server only
Character Encodings
UTF-8 compatibility tested with special characters and various languages: Korean, Japanese, Trad. & Simplif. Chinese, Hebrew, Arabic, Russian
UTF-8 (verified ) + various more encodings
Attribute Types
Case-level , Event-level
Specify Business Hours
Working week , Multiple shifts/day , Exclude days , Holiday calendar
Define Event Order
Manual definition of event ordering in case of identical timestamps. This criterion does not consider automatic ordering by the tool.
Start/End Timestamp
2 timestamps
Process Discovery
» Process Graph
As-Is Process Visualization
Directly-Follows Graph (horizontal, vertical)
Export As-Is Process Graph
For data exports (e.g. CSV) see “Export Reports” criterion
PNG, BPMN, XML
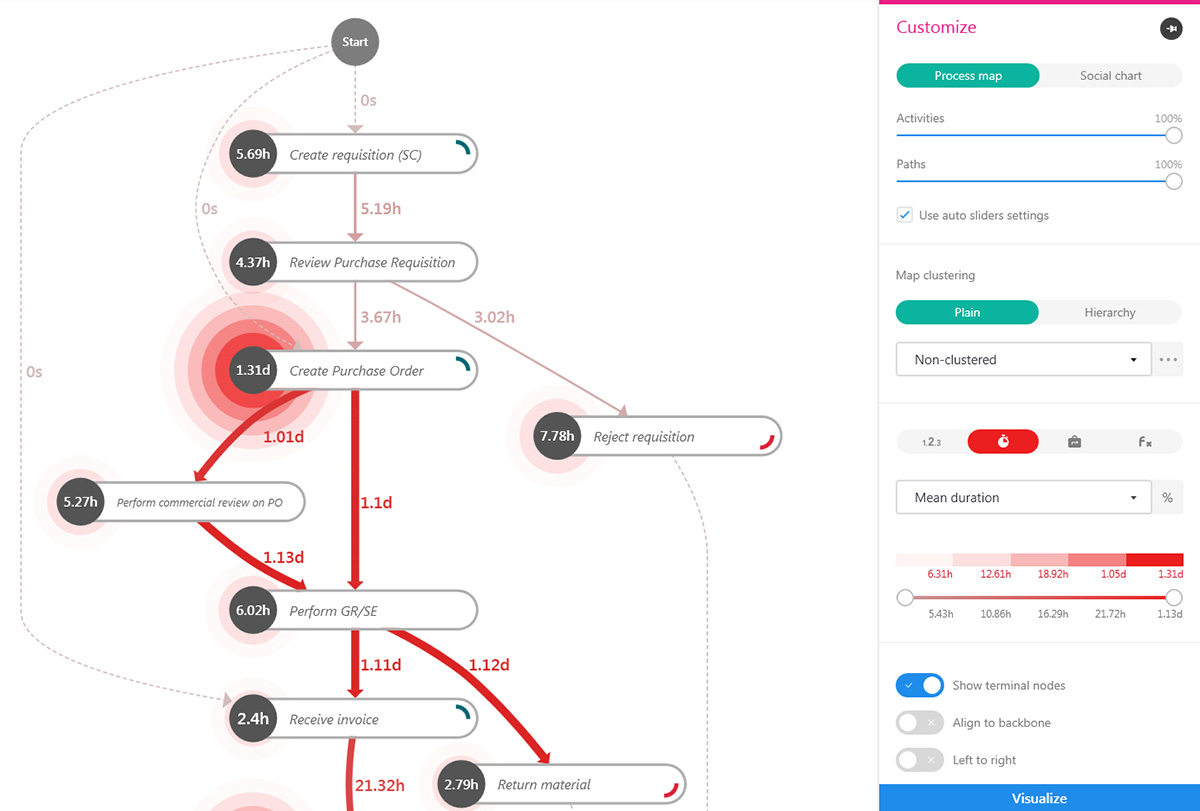
Performance Highlighting
Visual highlighting of process bottlenecks
Active time , Idle time
Process Animation (Replay)
Adjust speed , Adjust timeframe , Switch time mode , Zoom in case
Search and Filter in Graph
Search and find activity names (relevant for spaghetti-like graphs)
Filter activities/transitions directly from graph
Search , Filter
Graph Abstraction
Frequency Metrics
Activity frequency, Case frequency, Max. occurrence in case, Start/end activity frequency, Rework metrics
Time Metrics
The term “duration” is used when both active and waiting/idle times can be displayed
Tot/min/max/avg/std dev duration
Additional Graph Metrics
Cost metrics , Custom metrics
» Process Analysis & Analytics
Process Benchmarking
Visual comparison , Metric comparison
Process Benchmarking (Different Logs)
Visual comparison , Metric comparison
Root Cause Analysis
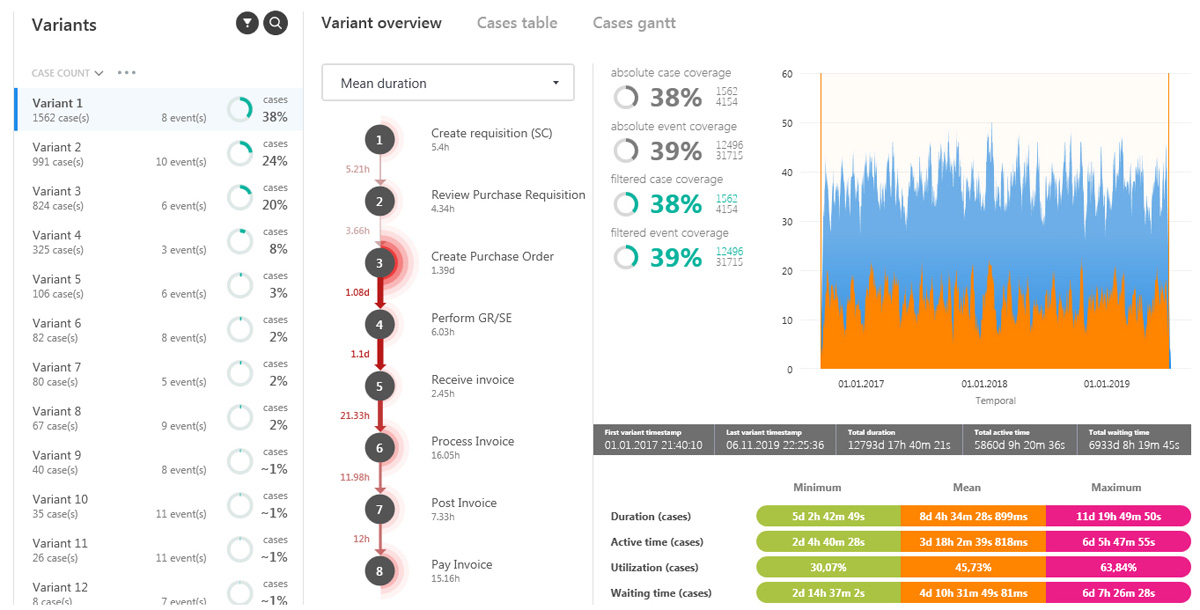
Variant Breakdown by
“Duration” refers to the case throughput time
Case count, event count, tot/min/max/avg duration and active/waiting time, min/max/avg utilization, finance metrics
Utilization = active time / case duration
Case and Activity List
Activity List , Case List , Case List for Variants
View Case Details
Rework Analysis
Comprehensive approach with various rework metrics such as (self-)loops, loop inflow/outflow and net loop gain in process graph and in tables
Edge/Transition Details
From-to activities: List of ingoing and outgoing activities for any selected activity
List of all transitions , From-to activities
List of all transitions via export as a matrix
Conformance Checking
Compare As-Is and Target Process
Target Model Creation
Import model (BPMN), Auto-create from as-is , Create new
Deviation from defined thresholds can be detected through color differentiation
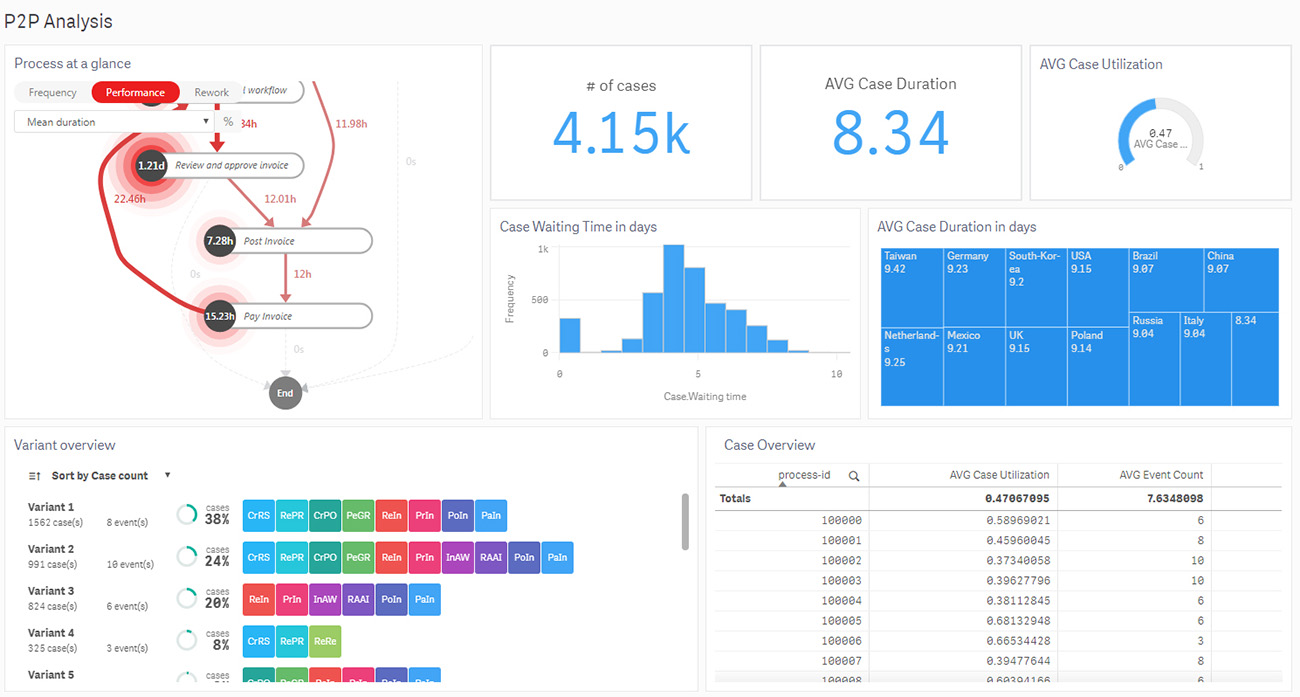
Advanced Charts
Dashboard offers >5 different chart types
World Map
Latitude & longitude coordinates , Location by attribute (e.g. country codes, city names)
Save Filter Settings
UI Languages
English, Portuguese, Russian, Slovak, Spanish
Share & Collaborate
Share selection ; Share projects; Chat/notes ("Newsfeed panel"); Snapshot function; Qlik Sense "Stories"; Live dashboard sharing via iframe embedding
Security & Compliance
Role-Based Access
Available for server deployment
User Authentication
Basic; Integrated Windows Authentication (Active Directory)
Audit Logs
Available upon request
Distinctive Focus and Features
Dashboards powered by Qlik Sense: Analytical views created in Minit can be published to “Minit Dashboards” on the Qlik Sense platform with drill-down capabilities and customizable sheets.
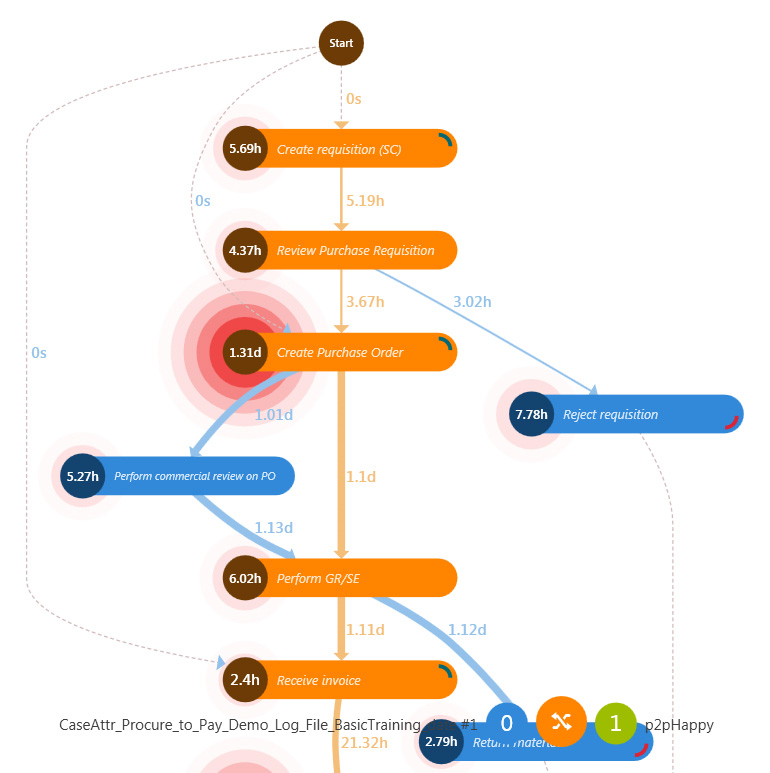
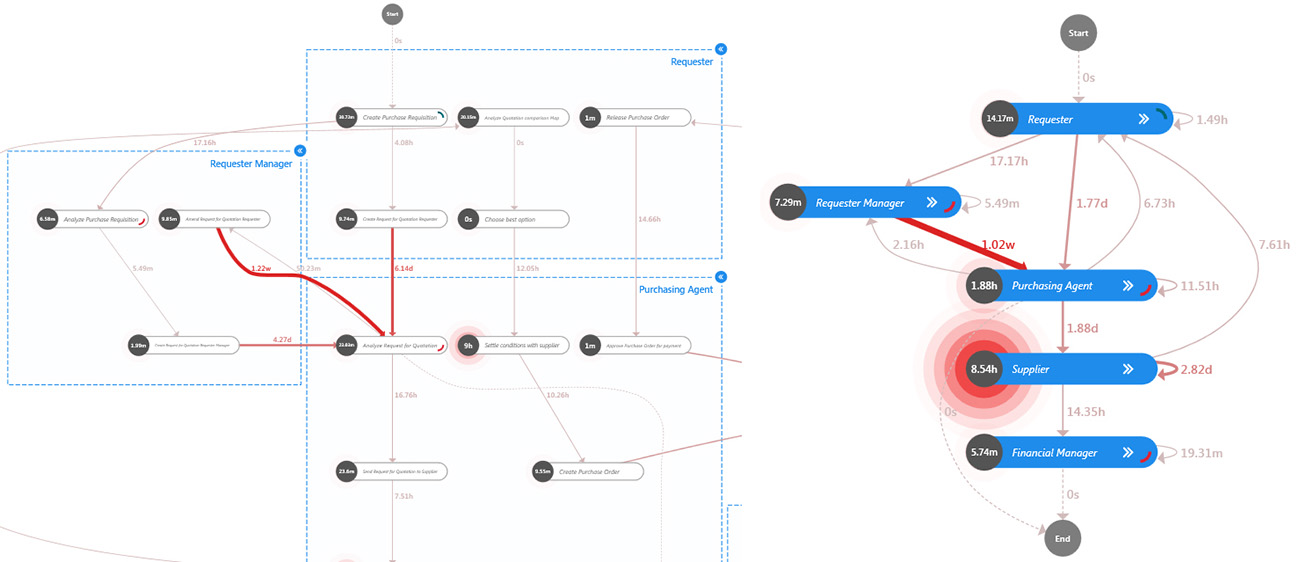
Hierarchical process mining: A patent-pending technology is used to examine process flows from a hierarchical perspective, hiding or revealing sub-processes based on hierarchy in the event log. The aggregated data is visible in the process graph while its level of abstraction can be adjusted accordingly. Use cases include organizational mining – hierarchy based on various company structure levels such as subsidiaries, divisions, departments and teams, RPA – hierarchies based on high-level log from LOB systems combined with hierarchical UI recordings or bot execution logs, etc.
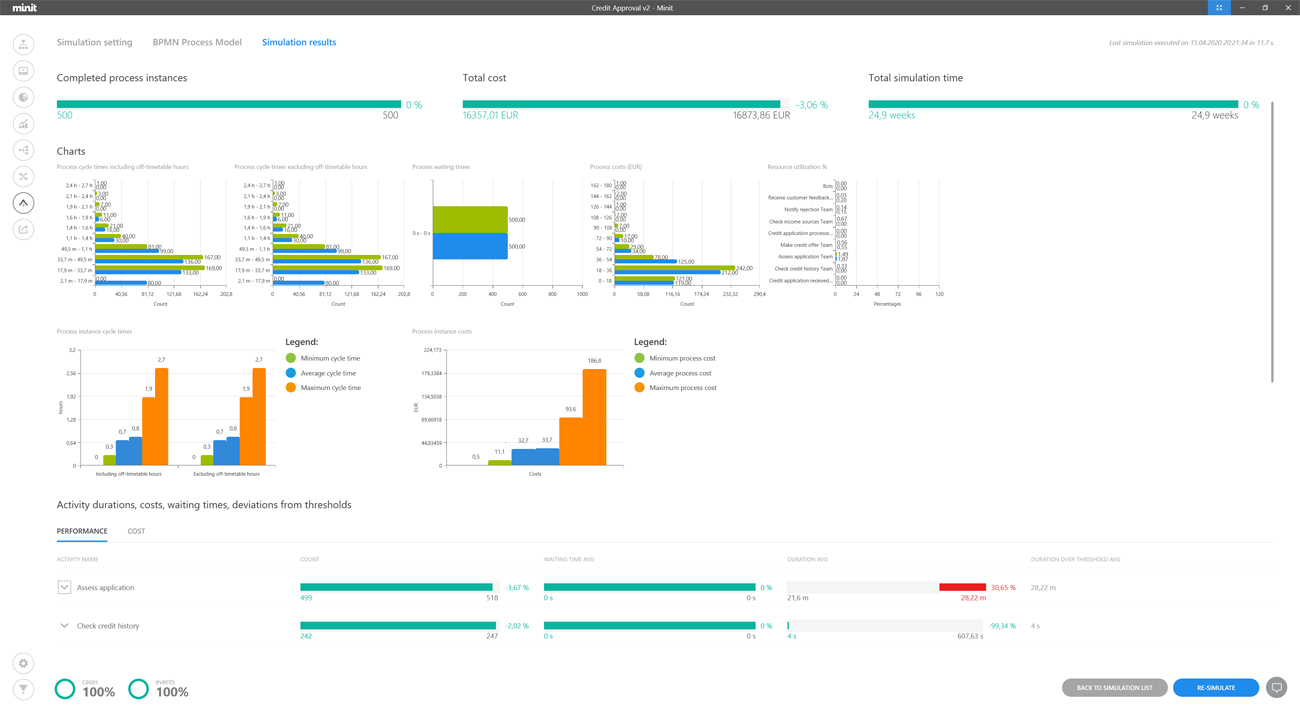
Process simulation: “What-if” scenarios can be created to evaluate potential process adjustment measures. Variables such as activity durations, man-hour rates, business hours and the deployment of RPA bots can be simulated.
Disclaimer: The timeliness of provided information is based on the tested version and date as stated under “Tested Version”. No guarantee can be given about the correctness and accuracy of the information contained.
Click to enlarge
Tap to enlarge
Process Graph
Process Variants
Dashboards
Conformance Checking
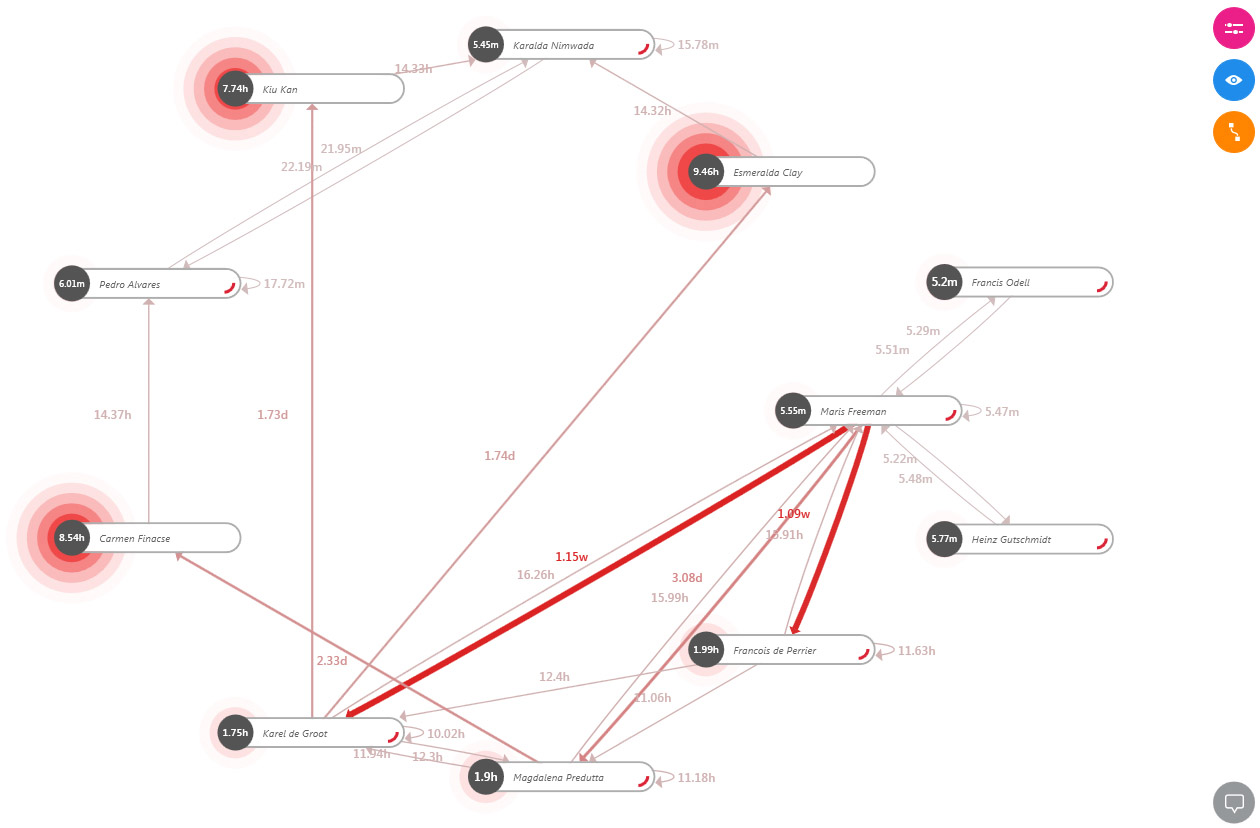
Social Network
Hierarchical
Process Graph
Simulation
Appetite for an additional visual impression of Minit?
This website uses cookies so that we can provide you with the best user experience possible. Cookie information is stored in your browser and performs functions such as recognizing you when you return to our website and helping our team to understand which sections of the website you find most interesting and useful.
Essential Cookies
Essential cookies enable basic functions and are necessary for the proper function of the website.
3rd Party Cookies
This website uses third party cookies. Google Analytics is used to help us improve our website by collecting anonymous information on how you use it. Content from third parties may also contain elements like YouTube videos which require cookies for proper functioning.
Please note that disabling third party cookies may prevent you from fully exploiting the features and services available.
Please enable Strictly Necessary Cookies first so that we can save your preferences!
Cookie Policy
For more information, please refer to our Cookie Policy.