Berlin-based Lana Labs was started by three co-founders with a passion for process optimization and a drive to bring new innovations into the Process Mining market. Years ago, the first innovations included automated conformance checks as well as Machine learning-based root cause analyses. LANA Process Mining is used by customers in various fields, including healthcare institutions, manufacturers and the utilities sector. Besides providing training videos and webinars, Lana Labs maintains a handy public Process Mining glossary. Fun fact: The company supports a colony of Magellanic penguins in Chile and adopts a new penguin for each license sold and each new employee onboarded. The name of the company is derived from their first adopted penguin called “Lana”.
Tool Name
LANA Process Mining
Vendor
Lana Labs GmbH (Berlin, Germany)
Company Size
11-50 employees
Free Trial
Upon request
Licenses
Commercial
Deployment
SaaS , On-Premises
Embedded In
–
Tested Version
4.4.1 (Cloud) - Tested in 06/2020
Data Management
Import File Types
CSV
Database Connections
JDBC drivers, ODBC drivers
PostgresSQL, MSSQL, SAP HANA, Oracle
Adapters/Connectors
SAP PI, SAP RFC, Salesforce, Microsoft Dynamics NAV, Manufacturing Execution Systems, REST API, Splunk API
Integrated ETL Functionality
Based on SQL commands
Data Anonymization & Pseudonymization
Not included in the tool, but part of the implementation
Data Loading
Data Refresh: Incremental data loading, appending new data to an existing set of data
Scheduled Jobs = Automatic data loading in defined time intervals
Data Refresh , Scheduled Jobs
Character Encodings
UTF-8 compatibility tested with special characters and various languages: Korean, Japanese, Trad. & Simplif. Chinese, Hebrew, Arabic, Russian
UTF-8 (verified )
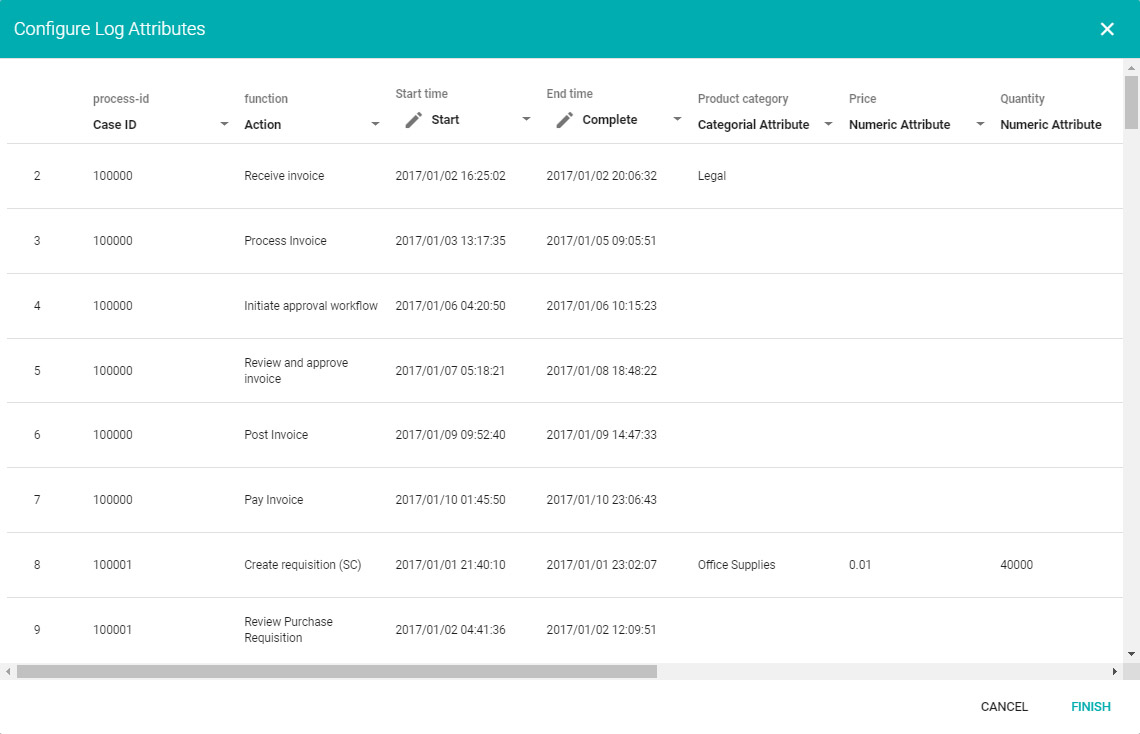
Attribute Types
Case-level , Event-level
Specify Business Hours
Working week , Multiple shifts/day , Exclude days , Holiday calendar
Define Event Order
Manual definition of event ordering in case of identical timestamps. This criterion does not consider automatic ordering by the tool.
Event sorting possible in data preprocessing
Start/End Timestamp
2 timestamps
Process Discovery
» Process Graph
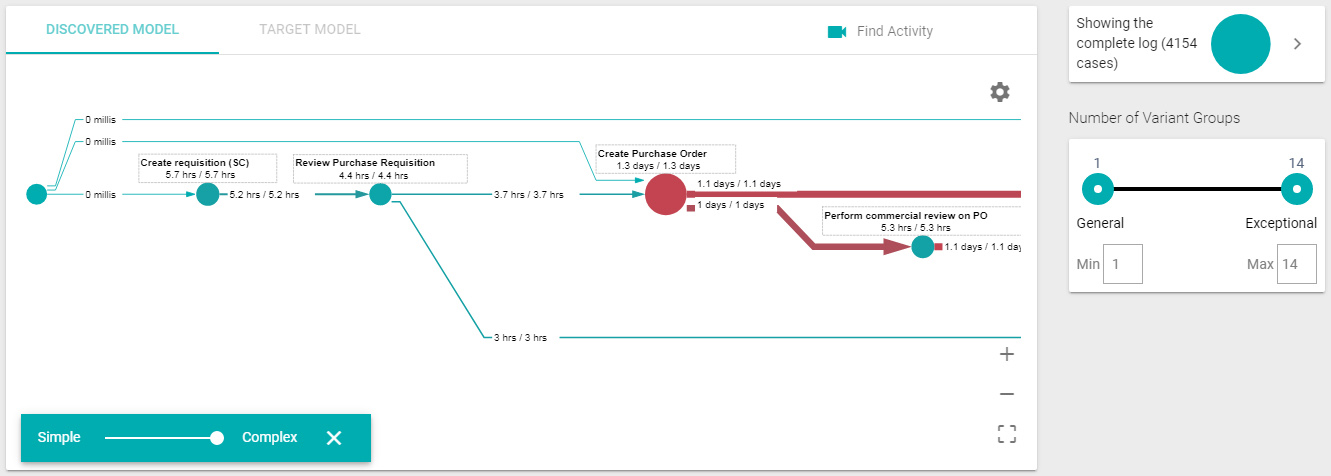
As-Is Process Visualization
Directly-Follows Graph (horizontal, vertical)
Export As-Is Process Graph
For data exports (e.g. CSV) see “Export Reports” criterion
BPMN, PDF, SVG
Performance Highlighting
Visual highlighting of process bottlenecks
Active time , Idle time
Process Animation (Replay)
Adjust speed , Adjust timeframe , Switch time mode , Zoom in case
Search and Filter in Graph
Search and find activity names (relevant for spaghetti-like graphs)
Filter activities/transitions directly from graph
Search , Filter
Graph Abstraction
Frequency Metrics
Activity frequency, Case frequency, Rework metrics, Skips (activities in target model skipped)
Time Metrics
The term “duration” is used when both active and waiting/idle times can be displayed
Tot/min/max/avg/med duration, Target durations (comparison of actual vs. target activity & transition durations)
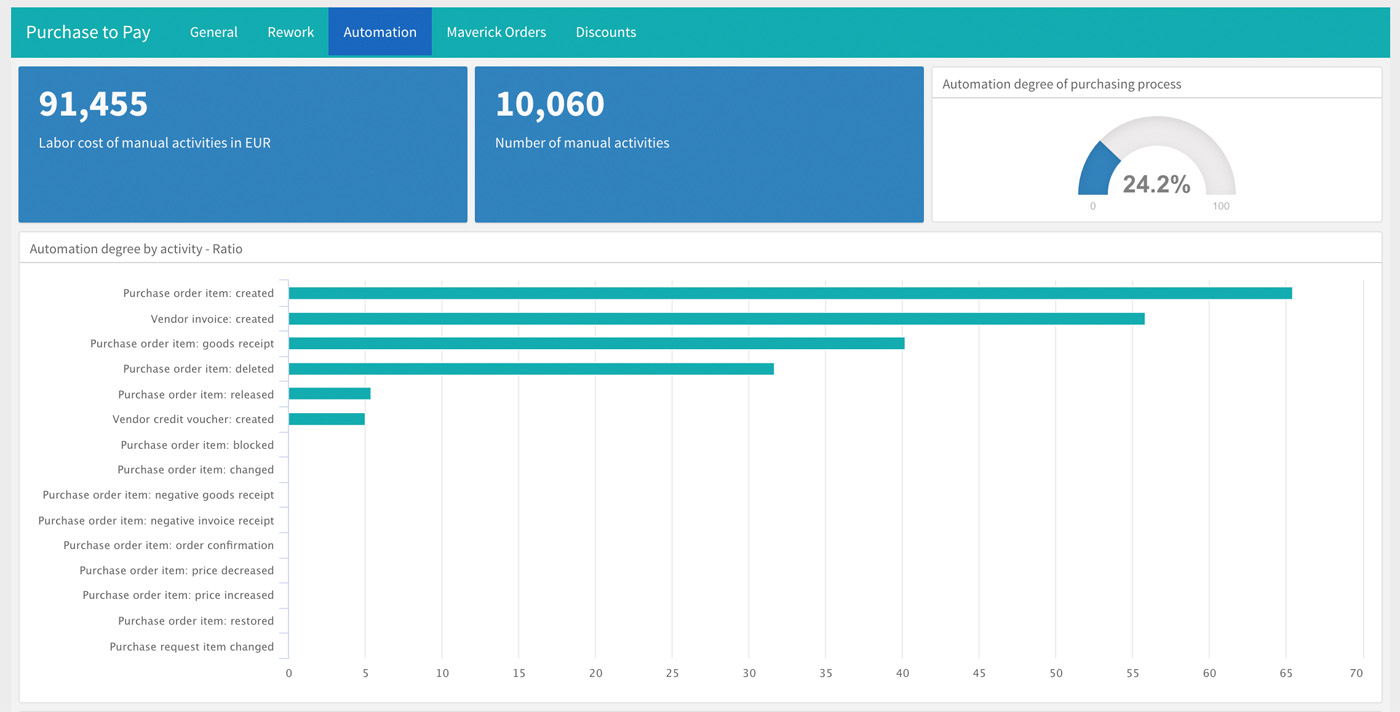
Additional Graph Metrics
Cost metrics , Custom metrics
» Process Analysis & Analytics
Process Benchmarking
Visual comparison , Metric comparison
Process Benchmarking (Different Logs)
Visual comparison , Metric comparison
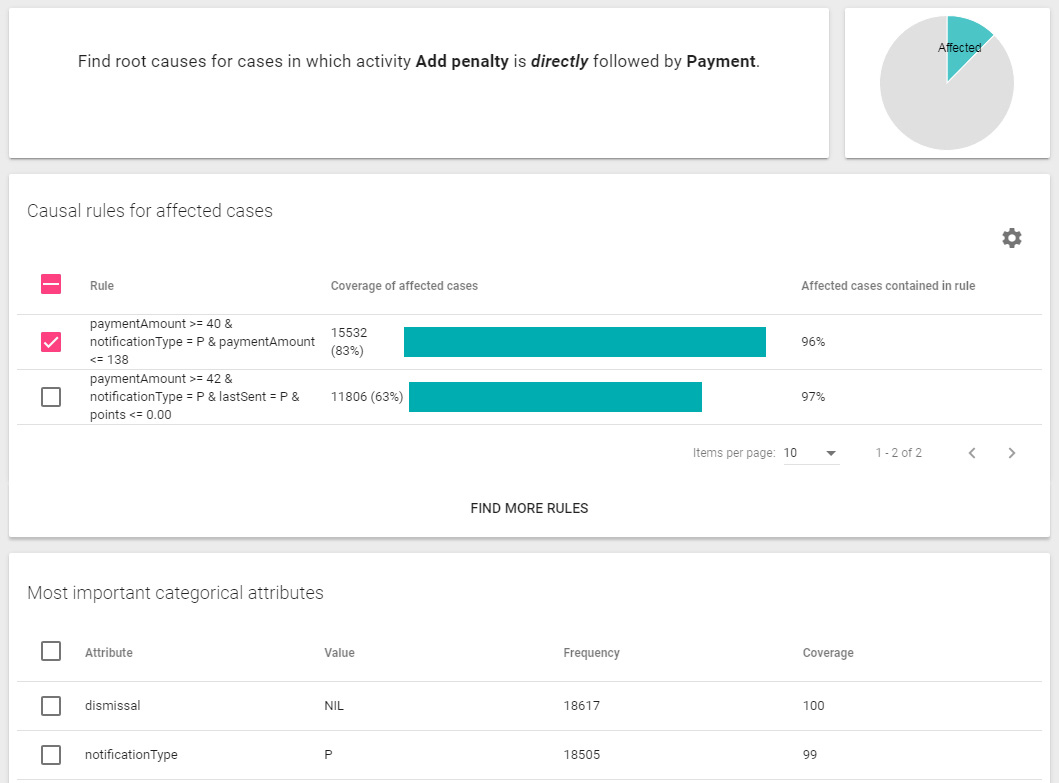
Root Cause Analysis
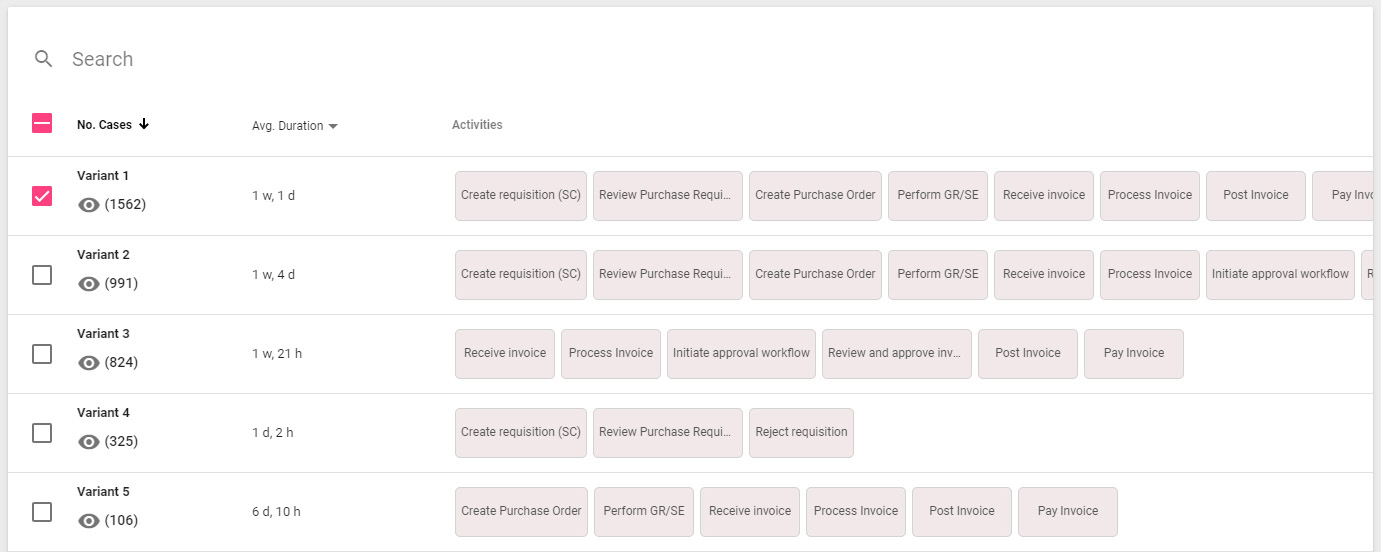
Variant Breakdown by
“Duration” refers to the case throughput time
Case count, event count, min/max/avg/med duration
Case and Activity List
Activity List , Case List , Case List for Variants
View Case Details
Rework Analysis
Edge/Transition Details
From-to activities: List of ingoing and outgoing activities for any selected activity
List of all transitions , From-to activities
Conformance Checking
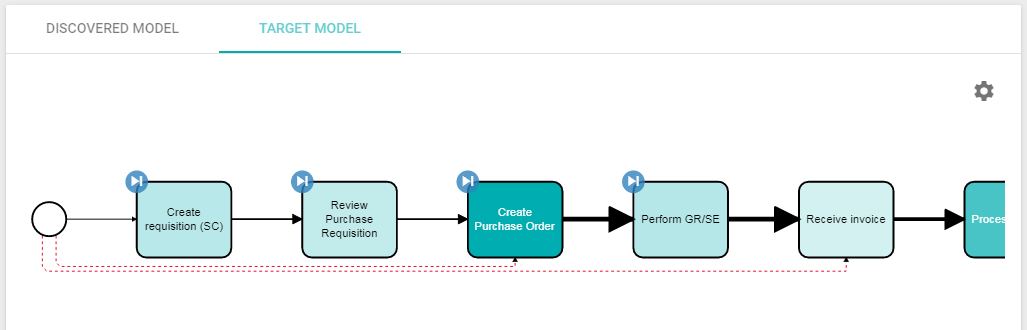
Compare As-Is and Target Process
Target Model Creation
Import model (BPMN), Auto-create from as-is , Create new
Events (CSV), Cases (CSV via API), Variants (BPMN, PDF, SVG)
Export Charts and Tables
Charts only
Custom Dashboards
Custom charts , Custom tables
Custom Metrics/KPIs
KPI Thresholds
Deviation from defined thresholds can be detected through color differentiation
Advanced Charts
Dashboard offers >5 different chart types
World Map
Latitude & longitude coordinates , Location by attribute (e.g. country codes, city names)
Save Filter Settings
UI Languages
English, German, Japanese
Share & Collaborate
Share selection ; Dashboard sharing
Security & Compliance
Role-Based Access
User Authentication
Basic
Audit Logs
Upon request
Distinctive Focus and Features
“Shiny” dashboards: LANA integrates “Shiny” dashboards from RStudio which allow total customization using R and various components such as HTML widgets and CSS themes. For simple visualizations, native LANA dashboards can be easily configured.
Root cause analysis: An algorithm identifies relevant influencing factors and forms rules for the problem causes of process deviations, non-compliant case durations and particular activity sequences.
Catering to individual needs: LANA Process Mining can be easily extended with additional functionalities through its open REST-APIs and open source packages “LanaR” and “PyLana”.
Disclaimer: The timeliness of provided information is based on the tested version and date as stated under “Tested Version”. No guarantee can be given about the correctness and accuracy of the information contained.
Click to enlarge
Tap to enlarge
Process Graph
Process Variants
Dashboards
Conformance Checking
Import Wizard
Root Cause Analysis
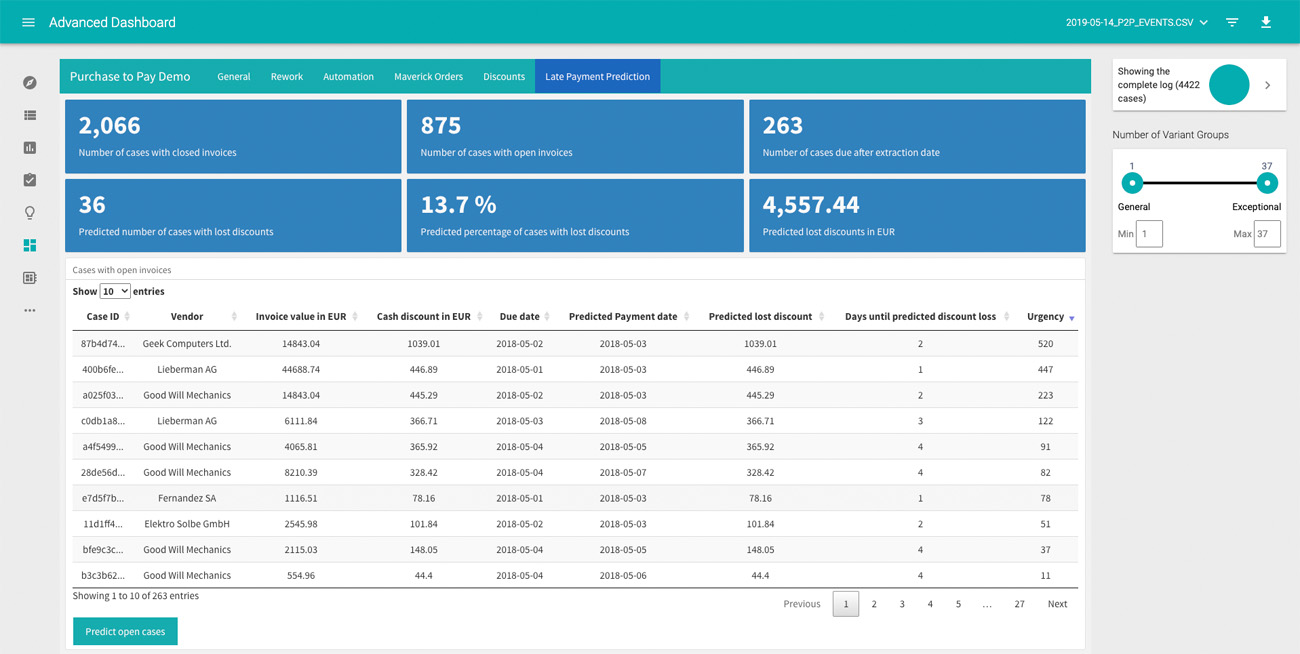
Event Prediction
Appetite for an additional visual impression of LANA Process Mining?
This website uses cookies so that we can provide you with the best user experience possible. Cookie information is stored in your browser and performs functions such as recognizing you when you return to our website and helping our team to understand which sections of the website you find most interesting and useful.
Essential Cookies
Essential cookies enable basic functions and are necessary for the proper function of the website.
3rd Party Cookies
This website uses third party cookies. Google Analytics is used to help us improve our website by collecting anonymous information on how you use it. Content from third parties may also contain elements like YouTube videos which require cookies for proper functioning.
Please note that disabling third party cookies may prevent you from fully exploiting the features and services available.
Please enable Strictly Necessary Cookies first so that we can save your preferences!
Cookie Policy
For more information, please refer to our Cookie Policy.