TimelinePI (now ABBYY Timeline) was founded in 2015 by Scott Opitz and Alex Elkin, based on their years of working with business intelligence and BPM tools. The tool focuses on the key areas of process discovery, diverse analytics, real-time robotic monitoring, and neural-network enabled prediction and alerting capabilities. Compared with the common process graph visualization of other tools, ABBYY Timeline differentiates itself through its unique Timeline visualization approach. Another noteworthy component is the Cloud-integrated ETL feature for advanced and big-data uploads with various transformation operations. TimelinePI was acquired by ABBYY in 2019.
Tool Name
ABBYY Timeline
Vendor
ABBYY (Milpitas, CA, USA)
Company Size
1001-5000 employees
Free Trial
Upon request
Licenses
Academic, Commercial
Deployment
SaaS , On-Premises
Embedded In
–
Tested Version
4.7.3 (SaaS, Build number 277) - Tested in 04/2020
Data Management
Import File Types
CSV
Supported file type can be uploaded in compressed format
Data Refresh: Incremental data loading, appending new data to an existing set of data
Scheduled Jobs = Automatic data loading in defined time intervals
Data Refresh , Scheduled Jobs
Character Encodings
UTF-8 compatibility tested with special characters and various languages: Korean, Japanese, Trad. & Simplif. Chinese, Hebrew, Arabic, Russian
UTF-8 (verified ), US ASCII
Attribute Types
Case-level , Event-level
No typical case-level mapping possible, however attribute filtering can be applied to the individual process event, even if data is imported from multiple systems of record
Specify Business Hours
Working week , Multiple shifts/day , Exclude days , Holiday calendar
Define Event Order
Manual definition of event ordering in case of identical timestamps. This criterion does not consider automatic ordering by the tool.
By custom sequence of activities
Start/End Timestamp
1 timestamp
Process Discovery
» Process Graph
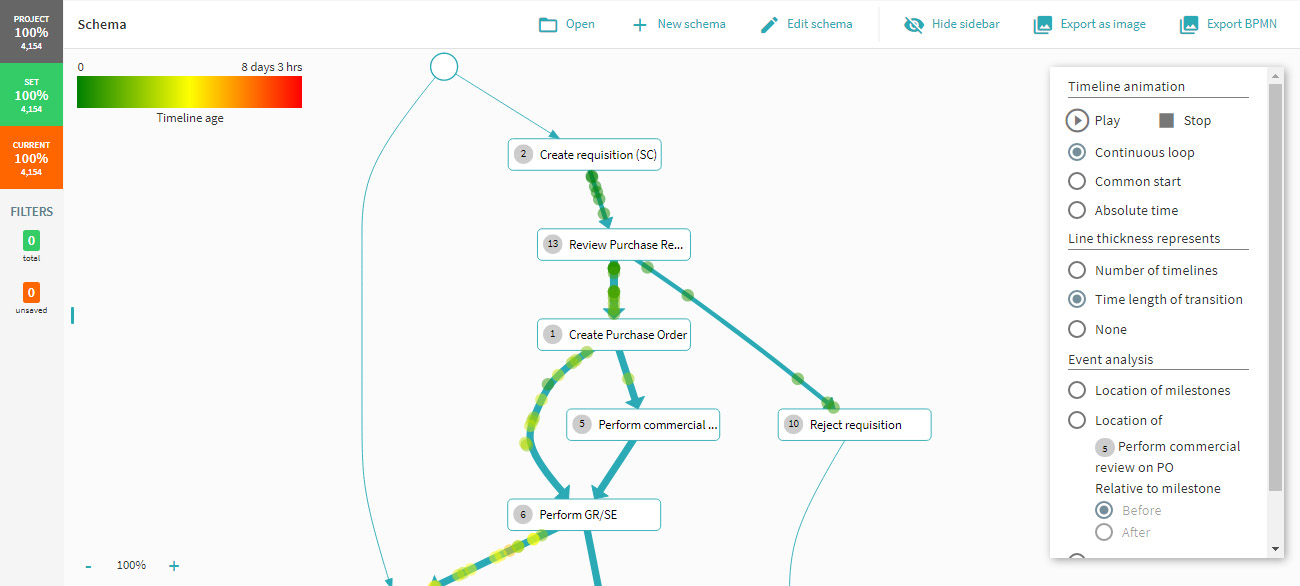
As-Is Process Visualization
Directly-Follows Graph (vertical), Case visualization*
*Distinctive "Timelines" visualization approach
Export As-Is Process Graph
For data exports (e.g. CSV) see “Export Reports” criterion
PNG, BPMN
Performance Highlighting
Visual highlighting of process bottlenecks
Active time , Idle time
Process Animation (Replay)
Adjust speed , Adjust timeframe , Switch time mode , Zoom in case
Search and Filter in Graph
Search and find activity names (relevant for spaghetti-like graphs)
Filter activities/transitions directly from graph
Search , Filter
Graph Abstraction
Frequency Metrics
Activity frequency
Time Metrics
The term “duration” is used when both active and waiting/idle times can be displayed
Avg waiting time
Waiting times (not active times) can be displayed as only 1 timestamp can be loaded
Additional Graph Metrics
Cost metrics , Custom metrics
» Process Analysis & Analytics
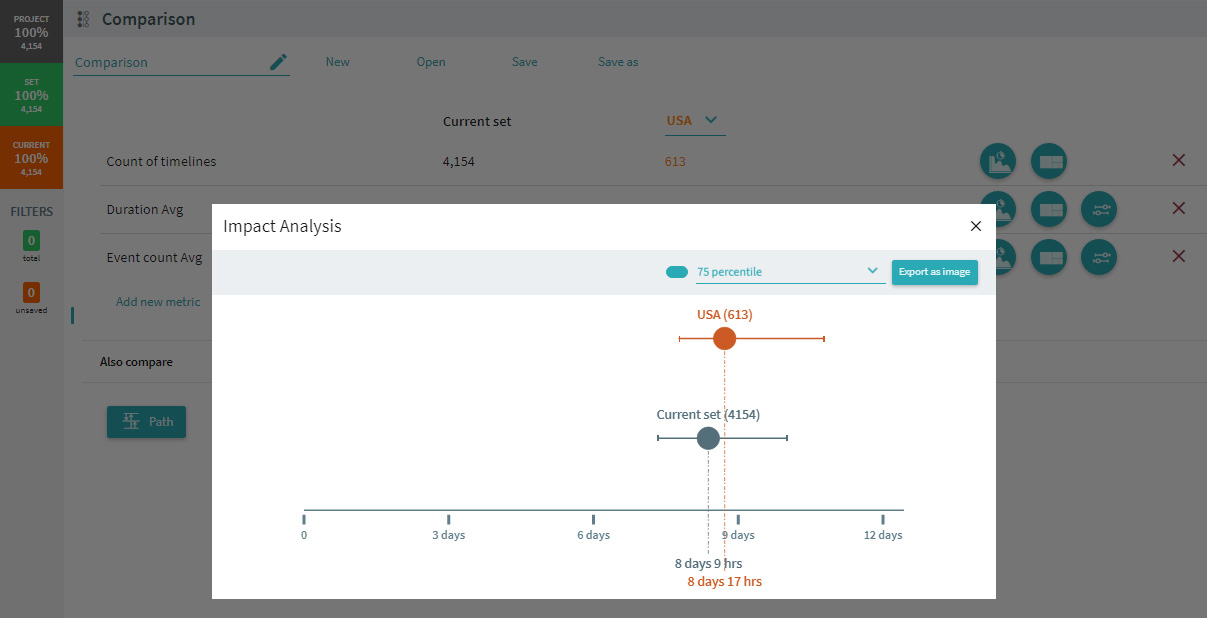
Process Benchmarking
Visual comparison , Metric comparison
Process Benchmarking (Different Logs)
Visual comparison , Metric comparison
Root Cause Analysis
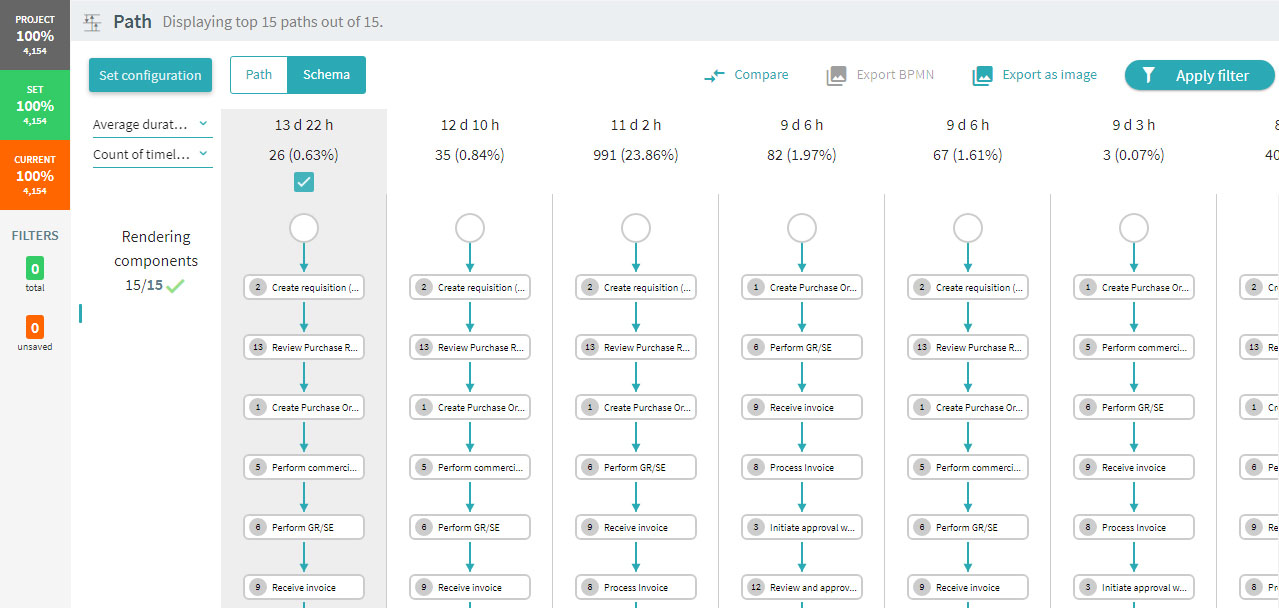
Variant Breakdown by
“Duration” refers to the case throughput time
Case count, event count, avg duration, avg/total cost
Case and Activity List
Activity List , Case List , Case List for Variants
View Case Details
Rework Analysis
Rework can be detected through filtering
Edge/Transition Details
From-to activities: List of ingoing and outgoing activities for any selected activity
List of all transitions , From-to activities
Conformance Checking
Compare As-Is and Target Process
Target Model Creation
In-Graph Conformance Visualization
List of Compliance Violations
Four-Eyes Principle
Sequence Filtering
“(Not) Directly followed by” filtering
Conformance Root Cause Analysis
Operational Support
Alert Generation
Predictive Analytics
Recommendations (Prescriptive Analytics)
Advanced Enhancement Capabilities
Organizational Mining
Scenario Simulation
Decision Rule Mining
Views, Monitoring and Reporting
Export Reports
Events (CSV), Cases (), Variants (PNG, BPMN)
Export Charts and Tables
Charts can only be exported as data (CSV)
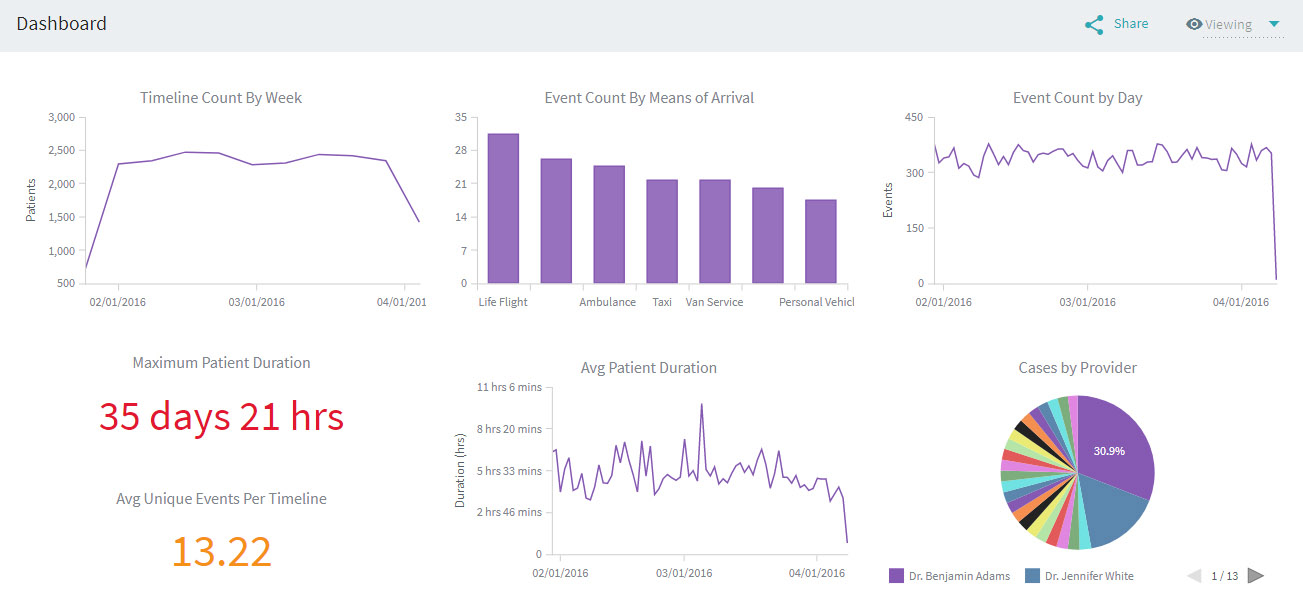
Custom Dashboards
Custom charts , Custom tables
Custom Metrics/KPIs
KPI Thresholds
Deviation from defined thresholds can be detected through color differentiation
Advanced Charts
Dashboard offers >5 different chart types
Chart library for multiple chart types upon request
World Map
Latitude & longitude coordinates , Location by attribute (e.g. country codes, city names)
External embedding of dashboards into other systems or platforms is possible via iframe
Security & Compliance
Role-Based Access
User Authentication
Basic; 2FA (SMS); SAML 2.0; Hybrid
Hybrid = login by ID and password, while password recovery will require tokens sent by email and SMS
Audit Logs
Distinctive Focus and Features
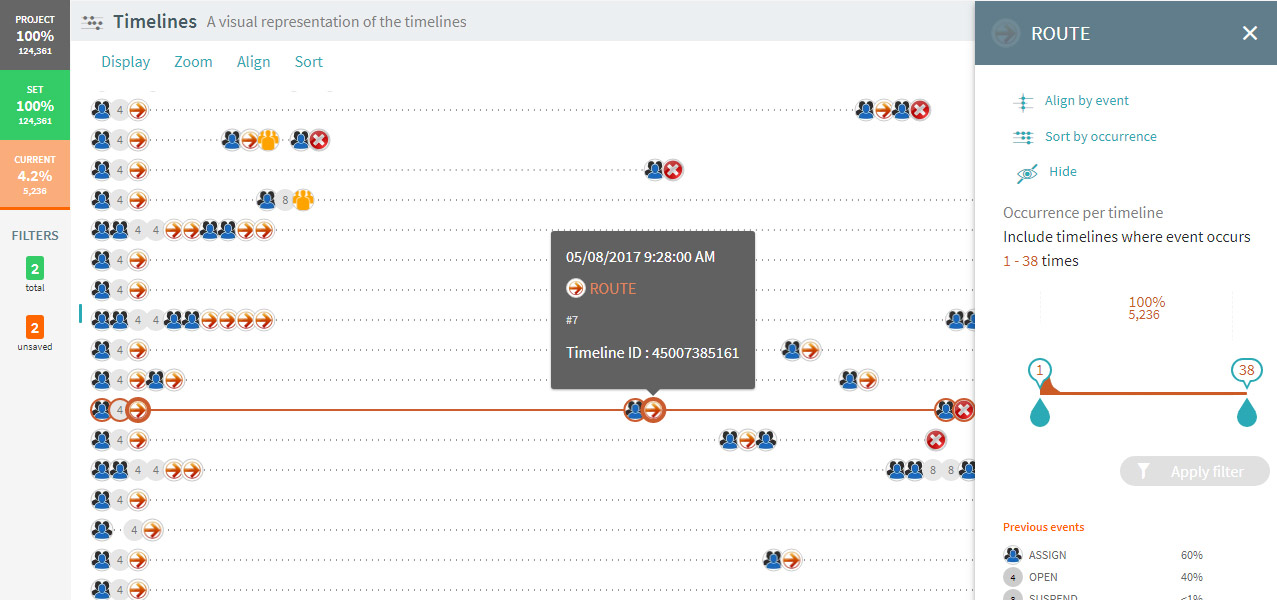
Timeline view: The unique approach visualizes all cases in one view and provides a single detailed view for any given case. Using an event pattern analysis, sub-processes and parallel processes can be automatically detected and grouped accordingly. This method can easily handle irregular and ad-hoc processes since the history does not depend on the process nature.
Powerful filter and breakdown analysis: The Query Analysis module enables the user to easily define complex search functions based on various process variables. Besides, the Protocol module can be used to define a set of rules or procedures in a prescriptive form to filter violations. Another module worth mentioning is the Breakdown Analysis which allows to easily drill down activities to attributes and visualize them in a treemap chart.
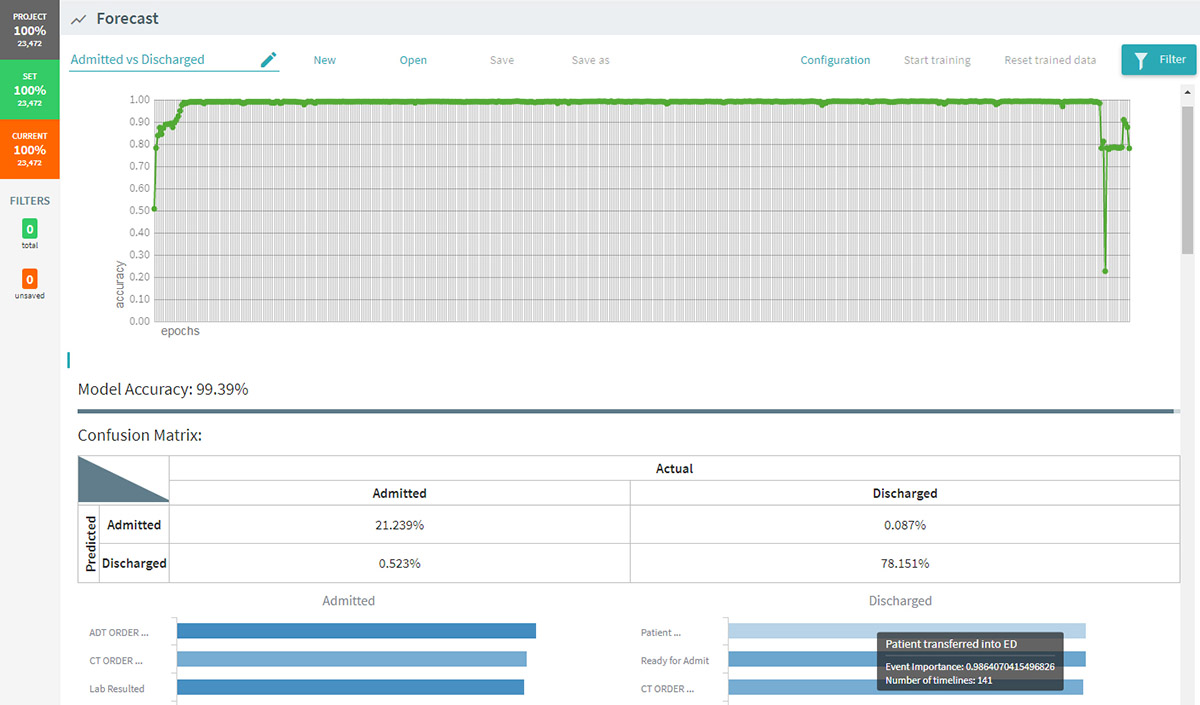
Forecasting: ABBYY Timeline offers an elaborate out-of-the-box forecasting functionality. The user can build a forecasting model with any desired process outcome for newly added data (open cases) and define significant attributes that are considered to have strong impact on the outcome. The system is trained based on historical data and returns a confusion matrix with false positives and false negatives. In addition, forecast outcomes can be filtered to trigger alerts depending on a previously defined confidence threshold. Notifications can be sent via SMS, email or directly to an IT system through a webhook.
Disclaimer: The timeliness of provided information is based on the tested version and date as stated under “Tested Version”. No guarantee can be given about the correctness and accuracy of the information contained.
Click to enlarge
Tap to enlarge
Process Graph
Process Variants
Dashboards
Benchmarking
Timelines
Forecasting
Appetite for an additional visual impression of ABBYY Timeline?
This website uses cookies so that we can provide you with the best user experience possible. Cookie information is stored in your browser and performs functions such as recognizing you when you return to our website and helping our team to understand which sections of the website you find most interesting and useful.
Essential Cookies
Essential cookies enable basic functions and are necessary for the proper function of the website.
3rd Party Cookies
This website uses third party cookies. Google Analytics is used to help us improve our website by collecting anonymous information on how you use it. Content from third parties may also contain elements like YouTube videos which require cookies for proper functioning.
Please note that disabling third party cookies may prevent you from fully exploiting the features and services available.
Please enable Strictly Necessary Cookies first so that we can save your preferences!
Cookie Policy
For more information, please refer to our Cookie Policy.